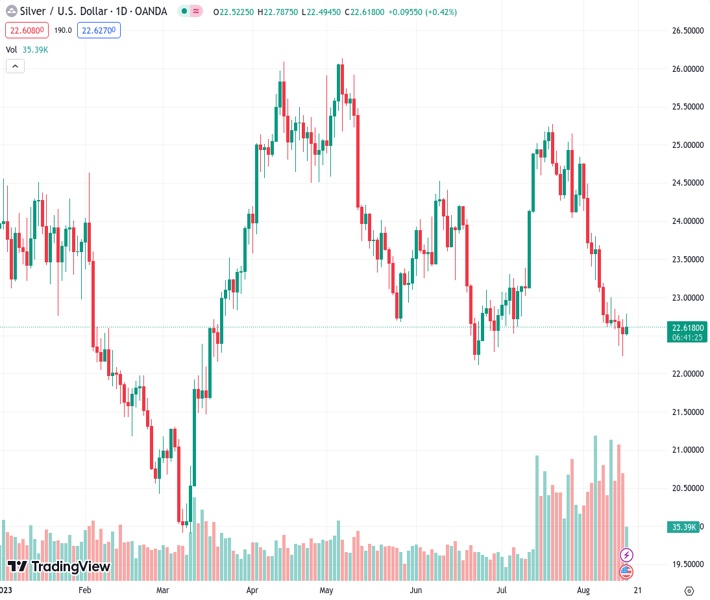
The price of silver remains steady at approximately $22.60 as investors are anticipating the release of the FOMC minutes to gain more clarity and direction.
…
This is a premium post.
[s2If !current_user_can(access_s2member_level4)]Please register for FREE REGISTER to read full post below containing analysis. In case of any error or you think you are not able to read the full post below, please email us at support#nehcap.com [lwa][/s2If] [s2If current_user_can(access_s2member_level1)]
- Silver price consolidates around $22.60 as investors await FOMC minutes for further guidance.
The pair currently trades last at 22.647.
The previous day high was 22.71 while the previous day low was 22.23. The daily 38.2% Fib levels comes at 22.41, expected to provide support. Similarly, the daily 61.8% fib level is at 22.53, expected to provide support.
Silver price (XAG/USD) remains sideways around $22.50 in the early New York session ahead of the release of the Federal Open Market Committee (FOMC) minutes. The white metal consolidates as FOMC minutes will provide more clarity about the interest rate guidance.
S&P500 adds some gains after opening as investors digest Fitch downgrade warning for US banks. The 10-year US Treasury yields rebounded above 4.20% as investors hope that inflation will remain sticky due to fading recession fears.
The US Dollar Index (DXY) seems misguided amid mixed cues about the interest rate outlook. Market participants hope that the Federal Reserve (Fed) would keep interest rates higher for a longer period. Discussions about rate cuts are scheduled any time for next year.
Meanwhile, the Fed reported that monthly Industrial Production rose sharply by 1.0% while investors forecasted expansion by 0.3%. In June, the economic data contracted by 0.8%. Monthly House Starts rose by 3.6% in July.
Silver price gathers strength to deliver a breakout of the Falling Wedge chart pattern, which indicates fading downside momentum, formed on a two-hour scale. A breakout of the aforementioned chart pattern will result in a bullish reversal. The 50-period Exponential Moving Average (EMA) at $22.65 continues to act as a barricade for the Silver bulls.
The Relative Strength Index (RSI) (14) oscillates in the 40.00-60.00 range, portraying a lackluster action.
Technical Levels: Supports and Resistances
XAGUSD currently trading at 22.62 at the time of writing. Pair opened at 22.52 and is trading with a change of 0.44 % .
| Overview | Overview.1 | |
|---|---|---|
| 0 | Today last price | 22.62 |
| 1 | Today Daily Change | 0.10 |
| 2 | Today Daily Change % | 0.44 |
| 3 | Today daily open | 22.52 |
The pair remains strongly bearish on the daily time frame. It trades below the 20 SMA @ 23.8, 50 SMA 23.62, 100 SMA @ 24.04 and 200 SMA @ 23.27.
| Trends | Trends.1 | |
|---|---|---|
| 0 | Daily SMA20 | 23.80 |
| 1 | Daily SMA50 | 23.62 |
| 2 | Daily SMA100 | 24.04 |
| 3 | Daily SMA200 | 23.27 |
The previous day high was 22.71 while the previous day low was 22.23. The daily 38.2% Fib levels comes at 22.41, expected to provide support. Similarly, the daily 61.8% fib level is at 22.53, expected to provide support.
Note the levels of interest below:
- Pivot support is noted at 22.26, 22.0, 21.78
- Pivot resistance is noted at 22.75, 22.97, 23.23
| Levels | Levels.1 |
|---|---|
| Previous Daily High | 22.71 |
| Previous Daily Low | 22.23 |
| Previous Weekly High | 23.68 |
| Previous Weekly Low | 22.58 |
| Previous Monthly High | 25.27 |
| Previous Monthly Low | 22.52 |
| Daily Fibonacci 38.2% | 22.41 |
| Daily Fibonacci 61.8% | 22.53 |
| Daily Pivot Point S1 | 22.26 |
| Daily Pivot Point S2 | 22.00 |
| Daily Pivot Point S3 | 21.78 |
| Daily Pivot Point R1 | 22.75 |
| Daily Pivot Point R2 | 22.97 |
| Daily Pivot Point R3 | 23.23 |
[/s2If]
Download Nehcap EAWe have two EAs that are operational on our LIVE accounts.
- EA-FIX: Check out the details here. Download EA-FIX . EA-FIX is a non-grid HFT scalper.
- EA-GROWTH: High quality low dd EA using trend grids. Download EA_GROWTHJoin Our Telegram Group
")


