The NZDUSD pair bounces back after reaching a new low for the year following the Reserve Bank of New Zealand’s optimistic stance.
…
This is a premium post.
[s2If !current_user_can(access_s2member_level4)]Please register for FREE REGISTER to read full post below containing analysis. In case of any error or you think you are not able to read the full post below, please email us at support#nehcap.com [lwa][/s2If] [s2If current_user_can(access_s2member_level1)]
- NZD/USD rebounds after hitting a fresh YTD low in reaction to the RBNZ’s hawkish outlook.
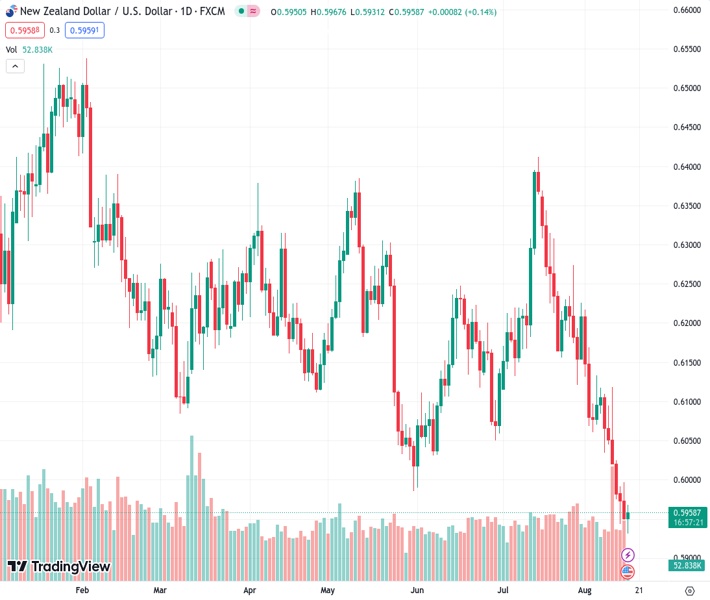
The pair currently trades last at 0.59603.
The previous day high was 0.5997 while the previous day low was 0.5947. The daily 38.2% Fib levels comes at 0.5966, expected to provide resistance. Similarly, the daily 61.8% fib level is at 0.5978, expected to provide resistance.
The NZD/USD pair stages a modest recovery from the 0.5930 area, or a fresh low since November 2022 touched during the Asian session on Wednesday in reaction to the Reserve Bank of New Zealand’s (RBNZ) hawkish outlook. Spot prices currently trade around the 0.5960-0.5965 region, up 0.20% for the day, and for now, seem to have snapped a six-day losing streak.
As was widely anticipated, the RBNZ decided to maintain the status quo and keep the key Official Cash Rate (OCR) steady at 5.50%. In the accompanying monetary policy statement, the central bank indicated that interest rates will remain at a restrictive level for some time. Furthermore, the central bank now forecasts OCR at 5.5% through December 2024 and then fall to 3.38% by September 2026. This, in turn, lends some support to the New Zealand Dollar (NZD), which, along with subdued US Dollar (USD) price action, prompts some short-covering around the NZD/USD pair.
The upside, however, remains capped, at least for the time being as traders now seem reluctant to place aggressive bets and prefer to wait for the release of the FOMC meeting minutes. The Federal Reserve (Fed) is anticipated to pause its rate-hiking cycle at the September policy meeting, though the markets have been pricing in the possibility of one more 25 bps lift-off by the end of this year. Hence, the minutes will be closely scrutinized for cues about the Fed’s future rate hike path, which will influence the USD price dynamics and provide a fresh directional impetus to the NZD/USD pair.
From a technical perspective, the recent breakdown through the previous YTD low – levels just below the 0.6000 psychological mark – was seen as a fresh trigger for bearish traders. That said, a slightly oversold Relative Strength Index (RSI) on the daily chart assists the NZD/USD pair to defend and rebound from the lower end of a nearly three-week-old descending channel. The said support is currently pegged around the 0.5930-0.5925 region and should act as a pivotal point, which if broken decisively will set the stage for an extension of the downfall witnessed over the past month or so.
Meanwhile, any subsequent recovery is more likely to confront stiff resistance near the overnight swing high, just ahead of the 0.6000 mark. A sustained strength beyond might trigger a short-covering rally towards the 0.6040 intermediate hurdle en route to the 0.6065-0.6070 region. The latter coincides with the ascending channel barrier, which if cleared might negate the negative outlook and shift the near-term bias in favour of bullish traders. The NZD/USD pair might then surpass the 0.6100 round figure and aim to retest the monthly swing high, around the 0.6130-0.6135 region.
Technical Levels: Supports and Resistances
NZDUSD currently trading at 0.5965 at the time of writing. Pair opened at 0.5951 and is trading with a change of 0.24 % .
| Overview | Overview.1 | |
|---|---|---|
| 0 | Today last price | 0.5965 |
| 1 | Today Daily Change | 0.0014 |
| 2 | Today Daily Change % | 0.2400 |
| 3 | Today daily open | 0.5951 |
The pair remains strongly bearish on the daily time frame. It trades below the 20 SMA @ 0.612, 50 SMA 0.616, 100 SMA @ 0.6179 and 200 SMA @ 0.6233.
| Trends | Trends.1 | |
|---|---|---|
| 0 | Daily SMA20 | 0.6120 |
| 1 | Daily SMA50 | 0.6160 |
| 2 | Daily SMA100 | 0.6179 |
| 3 | Daily SMA200 | 0.6233 |
The previous day high was 0.5997 while the previous day low was 0.5947. The daily 38.2% Fib levels comes at 0.5966, expected to provide resistance. Similarly, the daily 61.8% fib level is at 0.5978, expected to provide resistance.
Note the levels of interest below:
- Pivot support is noted at 0.5933, 0.5915, 0.5883
- Pivot resistance is noted at 0.5983, 0.6015, 0.6033
| Levels | Levels.1 |
|---|---|
| Previous Daily High | 0.5997 |
| Previous Daily Low | 0.5947 |
| Previous Weekly High | 0.6118 |
| Previous Weekly Low | 0.5974 |
| Previous Monthly High | 0.6413 |
| Previous Monthly Low | 0.6120 |
| Daily Fibonacci 38.2% | 0.5966 |
| Daily Fibonacci 61.8% | 0.5978 |
| Daily Pivot Point S1 | 0.5933 |
| Daily Pivot Point S2 | 0.5915 |
| Daily Pivot Point S3 | 0.5883 |
| Daily Pivot Point R1 | 0.5983 |
| Daily Pivot Point R2 | 0.6015 |
| Daily Pivot Point R3 | 0.6033 |
[/s2If]
Download Nehcap EAWe have two EAs that are operational on our LIVE accounts.
- EA-FIX: Check out the details here. Download EA-FIX . EA-FIX is a non-grid HFT scalper.
- EA-GROWTH: High quality low dd EA using trend grids. Download EA_GROWTHJoin Our Telegram Group
")


