The GBPUSD currency pair has decreased slightly during the Asian trading session on Wednesday, as it is being influenced by a strong US dollar.
…
This is a premium post.
[s2If !current_user_can(access_s2member_level4)]Please register for FREE REGISTER to read full post below containing analysis. In case of any error or you think you are not able to read the full post below, please email us at support#nehcap.com [lwa][/s2If] [s2If current_user_can(access_s2member_level1)]
- GBP/USD edges lower during the Asian session on Wednesday and is pressured by a bullish USD.
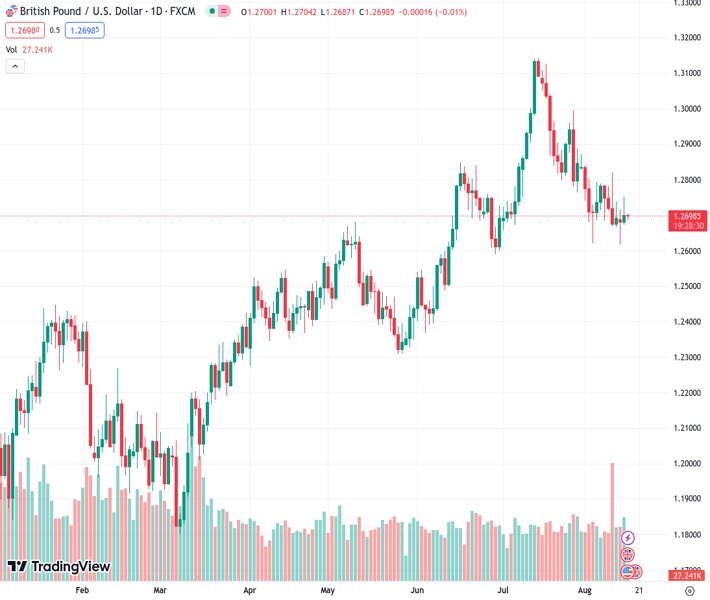
The pair currently trades last at 1.26974.
The previous day high was 1.2752 while the previous day low was 1.2675. The daily 38.2% Fib levels comes at 1.2723, expected to provide resistance. Similarly, the daily 61.8% fib level is at 1.2705, expected to provide resistance.
The GBP/USD pair extends the overnight pullback from a multi-day top, around mid-1.2700s and continues losing ground through the Asian session on Wednesday. Spot prices slid back below the 1.2700 round-figure mark and remain well within the striking distance of the 100-day Simple Moving Average (SMA) support near the 1.2620-1.2615 region, or the lowest level since June 30 touched on Monday.
The underlying bullish sentiment surrounding the US Dollar (USD), bolstered by expectations that the Federal Reserve (Fed) will stick to its hawkish stance, turns out to be a key factor exerting some downward pressure on the GBP/USD pair. Investors seem convinced that the US central bank will keep interest rates higher for longer and the bets were reaffirmed by the upbeat US Retail Sales data released on Tuesday, which indicated that consumer spending held up well in July.
That said, a 20 points slump in the Empire State Manufacturing Index to a reading of -19 in August reaffirms market expectations that the Fed will pause its rate-hiking cycle at the upcoming meeting in September. This, in turn, holds back the USD bulls from placing fresh bets and might lend some support to the GBP/USD pair. Traders also seem reluctant and prefer to wait for the release of the FOMC meeting minutes, which might provide fresh cues about the future rate-hike path.
Heading into the key event risk, traders will take cues from the US economic docket, featuring the release of Building Permits, Housing Starts and Industrial Production figures. In the meantime, strong wage growth data, which added to worries about long-term inflation and might force the Bank of England (BoE) to raise interest rates further, should contribute to limiting losses for the GBP/USD pair. This warrants caution before positioning for any further intraday downfall.
Technical Levels: Supports and Resistances
GBPUSD currently trading at 1.2692 at the time of writing. Pair opened at 1.2704 and is trading with a change of -0.09 % .
| Overview | Overview.1 | |
|---|---|---|
| 0 | Today last price | 1.2692 |
| 1 | Today Daily Change | -0.0012 |
| 2 | Today Daily Change % | -0.0900 |
| 3 | Today daily open | 1.2704 |
The pair is trading below its 20 Daily moving average @ 1.2789, below its 50 Daily moving average @ 1.2775 , above its 100 Daily moving average @ 1.2616 and above its 200 Daily moving average @ 1.2362
| Trends | Trends.1 | |
|---|---|---|
| 0 | Daily SMA20 | 1.2789 |
| 1 | Daily SMA50 | 1.2775 |
| 2 | Daily SMA100 | 1.2616 |
| 3 | Daily SMA200 | 1.2362 |
The previous day high was 1.2752 while the previous day low was 1.2675. The daily 38.2% Fib levels comes at 1.2723, expected to provide resistance. Similarly, the daily 61.8% fib level is at 1.2705, expected to provide resistance.
Note the levels of interest below:
- Pivot support is noted at 1.2669, 1.2634, 1.2592
- Pivot resistance is noted at 1.2746, 1.2788, 1.2823
| Levels | Levels.1 |
|---|---|
| Previous Daily High | 1.2752 |
| Previous Daily Low | 1.2675 |
| Previous Weekly High | 1.2819 |
| Previous Weekly Low | 1.2666 |
| Previous Monthly High | 1.3142 |
| Previous Monthly Low | 1.2659 |
| Daily Fibonacci 38.2% | 1.2723 |
| Daily Fibonacci 61.8% | 1.2705 |
| Daily Pivot Point S1 | 1.2669 |
| Daily Pivot Point S2 | 1.2634 |
| Daily Pivot Point S3 | 1.2592 |
| Daily Pivot Point R1 | 1.2746 |
| Daily Pivot Point R2 | 1.2788 |
| Daily Pivot Point R3 | 1.2823 |
[/s2If]
Download Nehcap EAWe have two EAs that are operational on our LIVE accounts.
- EA-FIX: Check out the details here. Download EA-FIX . EA-FIX is a non-grid HFT scalper.
- EA-GROWTH: High quality low dd EA using trend grids. Download EA_GROWTHJoin Our Telegram Group
")


