The GBPJPY currency pair increased to a level close to 186.20, reaching its highest point of the day and showing an increase of around 0.70%.
…
This is a premium post.
[s2If !current_user_can(access_s2member_level4)]Please register for FREE REGISTER to read full post below containing analysis. In case of any error or you think you are not able to read the full post below, please email us at support#nehcap.com [lwa][/s2If] [s2If current_user_can(access_s2member_level1)]
- GBP/JPY rose to a daily high near 186.20, displaying nearly 0.70% gains.
The pair currently trades last at 186.205.
The previous day high was 185.33 while the previous day low was 184.35. The daily 38.2% Fib levels comes at 184.95, expected to provide support. Similarly, the daily 61.8% fib level is at 184.72, expected to provide support.
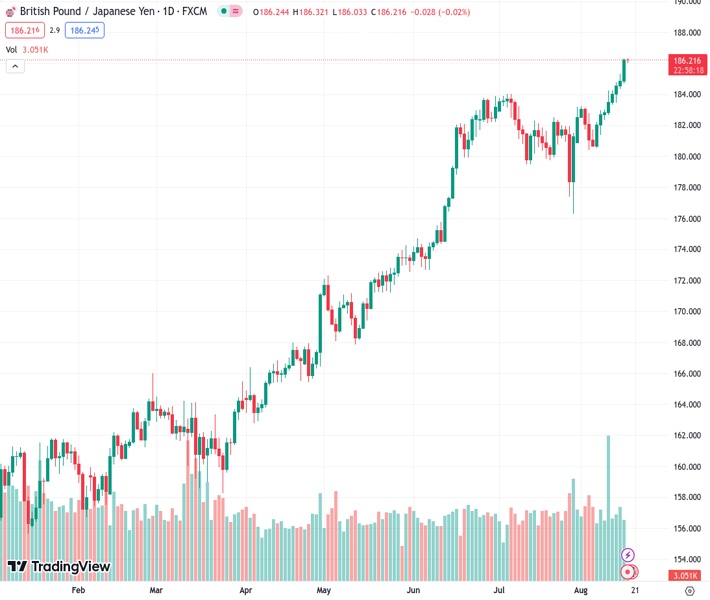
In Wednesday’s session, the GBP/JPY advanced to new cycle highs, near 186.20, mainly driven by the GBP’s strengths. The UK revealed higher-than-expected Consumer Price Index Figures from July, which boosted hawkish bets on the Bank of England (BoE) and British yields making the Pound gain interest. On the other hand, the Bank of Japan (BoJ) divergences against its peers, making the JPY weaker.
The British Consumer Price Index (CPI) declined to 6.8% YoY in July, as expected from its previous 7.9%. In addition, the Core CPI slightly accelerated to 6.9% YoY in the same month, above the expected 6.8% from its previous 6.9%. The Bank of England (BoE) tightening expectations continue to rise as a reaction. Instead of discounting a 5.75% at the start of the week, investors foresee a terminal rate of 6%, meaning an additional 75 basis points (bps) of tightening for this cycle. In that sense, the GBP got a boost and traded strongly against most of its rivals.
From a technical standpoint, the GBP/JPY maintains a bullish outlook for the short term, as observed on the daily chart. The Relative Strength Index (RSI) is comfortably positioned in the positive territory above its midline. It has a northward slope, complemented by a positive signal from the Moving Average Convergence Divergence (MACD), showing green bars, signalling a growing bullish momentum. Also, the pair is above the 20,100,200-day SMAs, implying that the bulls retain control on a broader scale.
Support levels: 184.00, 183.00, 182.15 (20-day SMA)
Resistance levels: 186.50, 187.00, 188.00.
Technical Levels: Supports and Resistances
GBPJPY currently trading at 186.22 at the time of writing. Pair opened at 184.94 and is trading with a change of 0.69 % .
| Overview | Overview.1 | |
|---|---|---|
| 0 | Today last price | 186.22 |
| 1 | Today Daily Change | 1.28 |
| 2 | Today Daily Change % | 0.69 |
| 3 | Today daily open | 184.94 |
The pair remains strongly bullish on the daily timeframe. It trades above its 20 SMA @ 182.13, 50 SMA 181.31, 100 SMA @ 175.15 and 200 SMA @ 168.77.
| Trends | Trends.1 | |
|---|---|---|
| 0 | Daily SMA20 | 182.13 |
| 1 | Daily SMA50 | 181.31 |
| 2 | Daily SMA100 | 175.15 |
| 3 | Daily SMA200 | 168.77 |
The previous day high was 185.33 while the previous day low was 184.35. The daily 38.2% Fib levels comes at 184.95, expected to provide support. Similarly, the daily 61.8% fib level is at 184.72, expected to provide support.
Note the levels of interest below:
- Pivot support is noted at 184.42, 183.89, 183.43
- Pivot resistance is noted at 185.4, 185.85, 186.38
| Levels | Levels.1 |
|---|---|
| Previous Daily High | 185.33 |
| Previous Daily Low | 184.35 |
| Previous Weekly High | 184.25 |
| Previous Weekly Low | 180.58 |
| Previous Monthly High | 184.02 |
| Previous Monthly Low | 176.32 |
| Daily Fibonacci 38.2% | 184.95 |
| Daily Fibonacci 61.8% | 184.72 |
| Daily Pivot Point S1 | 184.42 |
| Daily Pivot Point S2 | 183.89 |
| Daily Pivot Point S3 | 183.43 |
| Daily Pivot Point R1 | 185.40 |
| Daily Pivot Point R2 | 185.85 |
| Daily Pivot Point R3 | 186.38 |
[/s2If]
Download Nehcap EAWe have two EAs that are operational on our LIVE accounts.
- EA-FIX: Check out the details here. Download EA-FIX . EA-FIX is a non-grid HFT scalper.
- EA-GROWTH: High quality low dd EA using trend grids. Download EA_GROWTHJoin Our Telegram Group
")


