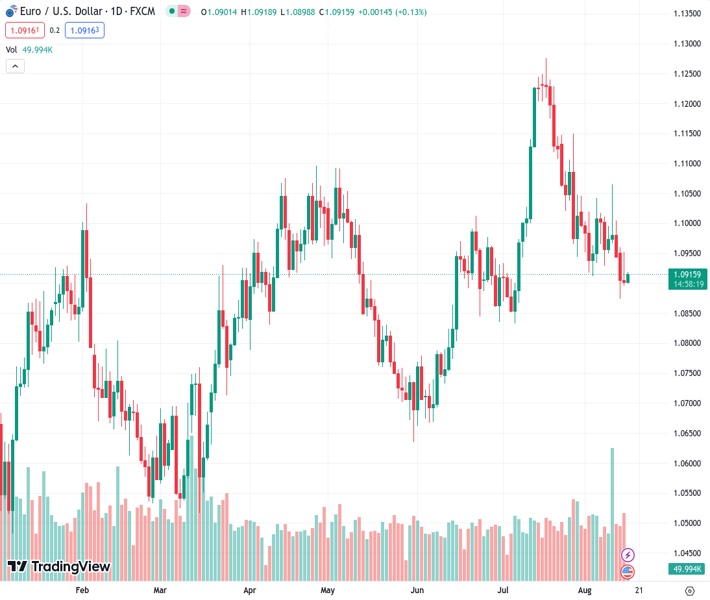
The EUR/USD pair is finding it difficult to advance and is maintaining its position above 1.0900 as it awaits important economic data from the Eurozone.
…
This is a premium post.
[s2If !current_user_can(access_s2member_level4)]Please register for FREE REGISTER to read full post below containing analysis. In case of any error or you think you are not able to read the full post below, please email us at support#nehcap.com [lwa][/s2If] [s2If current_user_can(access_s2member_level1)]
- EUR/USD struggles to gain and holds ground above 1.0900 ahead of the key Eurozone data.
The pair currently trades last at 1.09158.
The previous day high was 1.0952 while the previous day low was 1.0897. The daily 38.2% Fib levels comes at 1.0931, expected to provide resistance. Similarly, the daily 61.8% fib level is at 1.0918, expected to provide resistance.
The EUR/USD pair trades on a defensive note around the 1.0915 mark heading into the early European session on Wednesday. Market players await the Eurozone Gross Domestic Product (GDP) Q2 and Harmonized Index of Consumer Prices (HICP) for July, due later this week. The Eurozone growth number are expected to remain at 0.3% and 0.6% on a quarterly and yearly basis, respectively. While the Eurozone HICP MoM is expected to stay at -0.1%.
From the technical perspective, EUR/USD holds below the 50- and 100-day Exponential Moving Averages (EMAs), implying the path of least resistance for the EUR/USD is to the downside. That said, the Relative Strength Index (RSI) stands around 50, supporting the directionless movement for the major pair.
The key resistance level to watch for EUR/USD appears at 1.0940, representing the upper boundary of the Bollinger Band and the 100-hour EMA. Any meaningful follow-through buying beyond the latter could pave the way to the next barrier at 1.0980 (low of August 10) en route to 1.1000 (a psychological round mark, high of August 11). The additional upside filter is located at 1.1065 (high of August 11).
On the flip side, EUR/USD will meet the critical support level in the 1.0890–1.0900 zone, portraying a low of August 15 and a lower limit of the Bollinger Band. A decisive break below the latter would fuel a drop towards 1.0875 (low of August 14), followed by 1.0845 (low of June 23), and finally at 1.0830 (low of July 6).
Technical Levels: Supports and Resistances
EURUSD currently trading at 1.0916 at the time of writing. Pair opened at 1.0907 and is trading with a change of 0.08 % .
| Overview | Overview.1 | |
|---|---|---|
| 0 | Today last price | 1.0916 |
| 1 | Today Daily Change | 0.0009 |
| 2 | Today Daily Change % | 0.0800 |
| 3 | Today daily open | 1.0907 |
The pair is trading below its 20 Daily moving average @ 1.101, below its 50 Daily moving average @ 1.097 , below its 100 Daily moving average @ 1.0931 and above its 200 Daily moving average @ 1.0781
| Trends | Trends.1 | |
|---|---|---|
| 0 | Daily SMA20 | 1.1010 |
| 1 | Daily SMA50 | 1.0970 |
| 2 | Daily SMA100 | 1.0931 |
| 3 | Daily SMA200 | 1.0781 |
The previous day high was 1.0952 while the previous day low was 1.0897. The daily 38.2% Fib levels comes at 1.0931, expected to provide resistance. Similarly, the daily 61.8% fib level is at 1.0918, expected to provide resistance.
Note the levels of interest below:
- Pivot support is noted at 1.0885, 1.0864, 1.083
- Pivot resistance is noted at 1.094, 1.0974, 1.0996
| Levels | Levels.1 |
|---|---|
| Previous Daily High | 1.0952 |
| Previous Daily Low | 1.0897 |
| Previous Weekly High | 1.1065 |
| Previous Weekly Low | 1.0929 |
| Previous Monthly High | 1.1276 |
| Previous Monthly Low | 1.0834 |
| Daily Fibonacci 38.2% | 1.0931 |
| Daily Fibonacci 61.8% | 1.0918 |
| Daily Pivot Point S1 | 1.0885 |
| Daily Pivot Point S2 | 1.0864 |
| Daily Pivot Point S3 | 1.0830 |
| Daily Pivot Point R1 | 1.0940 |
| Daily Pivot Point R2 | 1.0974 |
| Daily Pivot Point R3 | 1.0996 |
[/s2If]
Download Nehcap EAWe have two EAs that are operational on our LIVE accounts.
- EA-FIX: Check out the details here. Download EA-FIX . EA-FIX is a non-grid HFT scalper.
- EA-GROWTH: High quality low dd EA using trend grids. Download EA_GROWTHJoin Our Telegram Group
")


