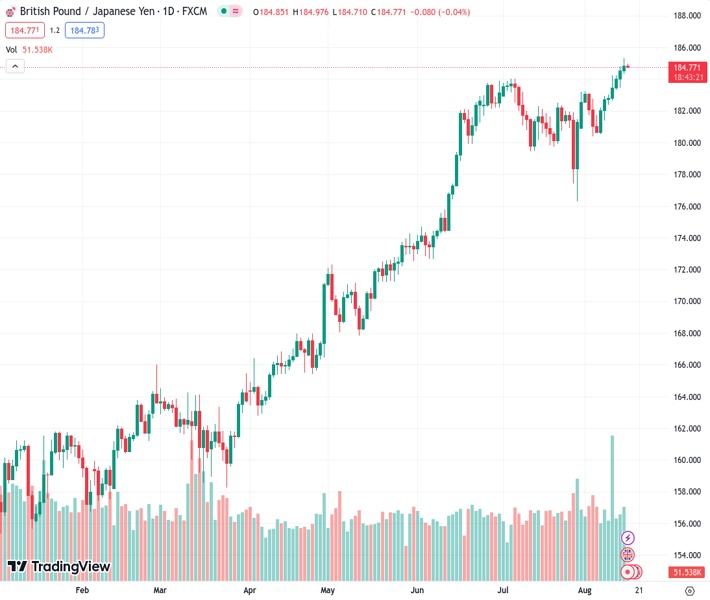
The current value of GBPJPY is approximately 184.80, which is a slight increase of 0.02% compared to the previous day’s trading.
…
This is a premium post.
[s2If !current_user_can(access_s2member_level4)]Please register for FREE REGISTER to read full post below containing analysis. In case of any error or you think you are not able to read the full post below, please email us at support#nehcap.com [lwa][/s2If] [s2If current_user_can(access_s2member_level1)]
- GBP/JPY currently trades around 184.80, up 0.02% for the day.
The pair currently trades last at 184.772.
The previous day high was 185.33 while the previous day low was 184.35. The daily 38.2% Fib levels comes at 184.95, expected to provide resistance. Similarly, the daily 61.8% fib level is at 184.72, expected to provide support.
The GBP/JPY cross consolidates its recent gains near 184.80 during the Asian session on Wednesday. Markets turn cautious ahead of the release of the UK Consumer Price Index (CPI) data later in the European session.
On Tuesday, the number of people employed in the United Kingdom declined by 66,000, versus the market consensus of an increase of 75,000. The Average Earnings excluding bonuses, rose 7.8% YoY in the three months to June. This figure indicates the highest annual growth rate since records began in 2001, while Average Earnings including bonuses, reached 8.2%, the fastest pace since the coronavirus pandemic period. Meanwhile, the Unemployment Rate increased to 4.2% from 4%.
Market participants are cautious about the BoE’s move as the UK economy is fragile and the interest rate is at a 15-year high of 5.25%. The aggressive monetary policy could negatively affect the British economy. However, market participants will take cues from the UK Consumer Price Index (CPI) and Retail Sales MoM for July, due later in the day. The upbeat data could boost the Pound Sterling and act as a tailwind for the GBP/JPY cross.
On the Japanese Yen front, the preliminary data of the Gross Domestic Product (GDP) figures for the second quarter (Q2) of 2023 shows that economic growth in Japan came in at 1.5% QoQ, versus 0.8% expected and 0.7% previously. Meanwhile, the annualised GDP increased to 6.0%, compared to 3.1% estimated and 2.7% previously.
Following the stronger than expected data on Tuesday, Japan’s Economy Minister Shigeyuki Goto stated that he anticipated a moderate economic recovery before mentioning the need to pay attention to the danger of a global downturn and the impacts of price increases. Goto demonstrated a willingness to respond flexibly to the economy and prices as needed. That said, the divergence between the dovish stance of the Bank of Japan (BoJ) and the hawkish stance of the Bank of England (BoE) leads to the weakening of the Japanese Yen against its major rivals.
Looking ahead, investors will closely watch the UK CPI. The annual and core inflation figures are expected to decline by 6.8%. On the Japanese docket, the nation’s Trade data and annual National Consumer Price Index for July will be released later this week.
Technical Levels: Supports and Resistances
GBPJPY currently trading at 184.82 at the time of writing. Pair opened at 184.94 and is trading with a change of -0.06 % .
| Overview | Overview.1 | |
|---|---|---|
| 0 | Today last price | 184.82 |
| 1 | Today Daily Change | -0.12 |
| 2 | Today Daily Change % | -0.06 |
| 3 | Today daily open | 184.94 |
The pair remains strongly bullish on the daily timeframe. It trades above its 20 SMA @ 182.13, 50 SMA 181.31, 100 SMA @ 175.15 and 200 SMA @ 168.77.
| Trends | Trends.1 | |
|---|---|---|
| 0 | Daily SMA20 | 182.13 |
| 1 | Daily SMA50 | 181.31 |
| 2 | Daily SMA100 | 175.15 |
| 3 | Daily SMA200 | 168.77 |
The previous day high was 185.33 while the previous day low was 184.35. The daily 38.2% Fib levels comes at 184.95, expected to provide resistance. Similarly, the daily 61.8% fib level is at 184.72, expected to provide support.
Note the levels of interest below:
- Pivot support is noted at 184.42, 183.89, 183.43
- Pivot resistance is noted at 185.4, 185.85, 186.38
| Levels | Levels.1 |
|---|---|
| Previous Daily High | 185.33 |
| Previous Daily Low | 184.35 |
| Previous Weekly High | 184.25 |
| Previous Weekly Low | 180.58 |
| Previous Monthly High | 184.02 |
| Previous Monthly Low | 176.32 |
| Daily Fibonacci 38.2% | 184.95 |
| Daily Fibonacci 61.8% | 184.72 |
| Daily Pivot Point S1 | 184.42 |
| Daily Pivot Point S2 | 183.89 |
| Daily Pivot Point S3 | 183.43 |
| Daily Pivot Point R1 | 185.40 |
| Daily Pivot Point R2 | 185.85 |
| Daily Pivot Point R3 | 186.38 |
[/s2If]
Download Nehcap EAWe have two EAs that are operational on our LIVE accounts.
- EA-FIX: Check out the details here. Download EA-FIX . EA-FIX is a non-grid HFT scalper.
- EA-GROWTH: High quality low dd EA using trend grids. Download EA_GROWTHJoin Our Telegram Group
")


