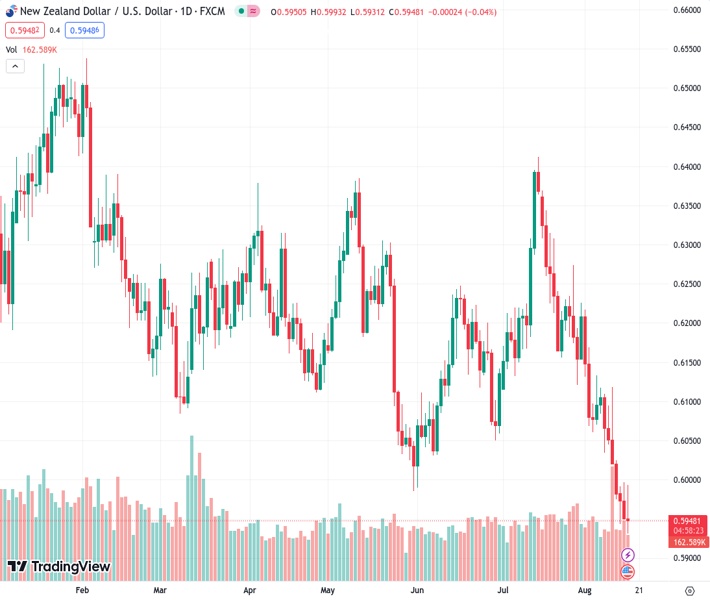
The currency pair NZDUSD reached a peak close to 0.6000 after starting at 0.59475, but eventually stabilized around 0.5950.
…
This is a premium post.
[s2If !current_user_can(access_s2member_level4)]Please register for FREE REGISTER to read full post below containing analysis. In case of any error or you think you are not able to read the full post below, please email us at support#nehcap.com [lwa][/s2If] [s2If current_user_can(access_s2member_level1)]
- NZD/USD rose to a high of near 0.6000 but settled near 0.5950.
The pair currently trades last at 0.59475.
The previous day high was 0.5997 while the previous day low was 0.5947. The daily 38.2% Fib levels comes at 0.5966, expected to provide resistance. Similarly, the daily 61.8% fib level is at 0.5978, expected to provide resistance.
On Wednesday, the NZD/USD traded strongly following the Reserve Bank of New Zealand (RBNZ) decision but failed to maintain its momentum and backed away towards 0.5950. On the other hand, the USD measured by the DXY trades flat, ahead of the Federal Open Market Committee (FOMC) minutes from the July meeting. Housing data from July didn’t impact the USD across the board.
The Reserve Bank of New Zealand (RBNZ) held its rates at 5.5%, as expected, but there were some hawkish signals in the statement. The Committee stated that the Official Cash Rate (OCR) “show remains at restrictive levels” for the foreseeable future and pointed out that economic activity and inflationary pressures do not slow down much as expected. In that sense, markets will model their expectations on incoming data to see whether the RBNZ is eventually forced to hike again; as for now, the World Interest Rate Possibilities tool (WIRP) suggests that the markets are confident that the bank won’t hike this cycle again and will start to ease in H2 2024.
Housing data from the US from July came in strong. Building permits rose by 0.1% vs the expected 1.7% contraction, while housing starts increased by 3.9%, also higher than the 2.7% expected. That being said, the session’s highlight will be the release the FOMC minutes from July, where investors will look for clues regarding forward guidance. The latest data from the US revealed that the economy is clearly strong and that inflation is somewhat softish but still has some upside risk. As for now, markets expect the Federal Reserve (Fed) to skip in September, and the odds of a 25 bps hike in the November meeting rose to nearly 40%, according to the WIRP tool.
Based on the daily chart, the NZD/USD exhibits a bearish outlook for the short term. Both the Relative Strength Index (RSI) and Moving Average Convergence Divergence (MACD) remain in negative territory, with the RSI below its midline and showing a southward slope. The MACD is also displaying red bars, indicating a strengthening bearish momentum. Additionally, the pair is below the 20,100 and 200-day Simple Moving Averages (SMAs), suggesting that the bears are firmly in control of the bigger picture, leaving the buyers with tasks to accomplish.
Support levels: 0.5950, 0.5930, 0.5920.
Resistance levels: 0.6000, 0.6020, 0.6050.
Technical Levels: Supports and Resistances
NZDUSD currently trading at 0.5948 at the time of writing. Pair opened at 0.5951 and is trading with a change of -0.05 % .
| Overview | Overview.1 | |
|---|---|---|
| 0 | Today last price | 0.5948 |
| 1 | Today Daily Change | -0.0003 |
| 2 | Today Daily Change % | -0.0500 |
| 3 | Today daily open | 0.5951 |
The pair remains strongly bearish on the daily time frame. It trades below the 20 SMA @ 0.612, 50 SMA 0.616, 100 SMA @ 0.6179 and 200 SMA @ 0.6233.
| Trends | Trends.1 | |
|---|---|---|
| 0 | Daily SMA20 | 0.6120 |
| 1 | Daily SMA50 | 0.6160 |
| 2 | Daily SMA100 | 0.6179 |
| 3 | Daily SMA200 | 0.6233 |
The previous day high was 0.5997 while the previous day low was 0.5947. The daily 38.2% Fib levels comes at 0.5966, expected to provide resistance. Similarly, the daily 61.8% fib level is at 0.5978, expected to provide resistance.
Note the levels of interest below:
- Pivot support is noted at 0.5933, 0.5915, 0.5883
- Pivot resistance is noted at 0.5983, 0.6015, 0.6033
| Levels | Levels.1 |
|---|---|
| Previous Daily High | 0.5997 |
| Previous Daily Low | 0.5947 |
| Previous Weekly High | 0.6118 |
| Previous Weekly Low | 0.5974 |
| Previous Monthly High | 0.6413 |
| Previous Monthly Low | 0.6120 |
| Daily Fibonacci 38.2% | 0.5966 |
| Daily Fibonacci 61.8% | 0.5978 |
| Daily Pivot Point S1 | 0.5933 |
| Daily Pivot Point S2 | 0.5915 |
| Daily Pivot Point S3 | 0.5883 |
| Daily Pivot Point R1 | 0.5983 |
| Daily Pivot Point R2 | 0.6015 |
| Daily Pivot Point R3 | 0.6033 |
[/s2If]
Download Nehcap EAWe have two EAs that are operational on our LIVE accounts.
- EA-FIX: Check out the details here. Download EA-FIX . EA-FIX is a non-grid HFT scalper.
- EA-GROWTH: High quality low dd EA using trend grids. Download EA_GROWTHJoin Our Telegram Group
")


