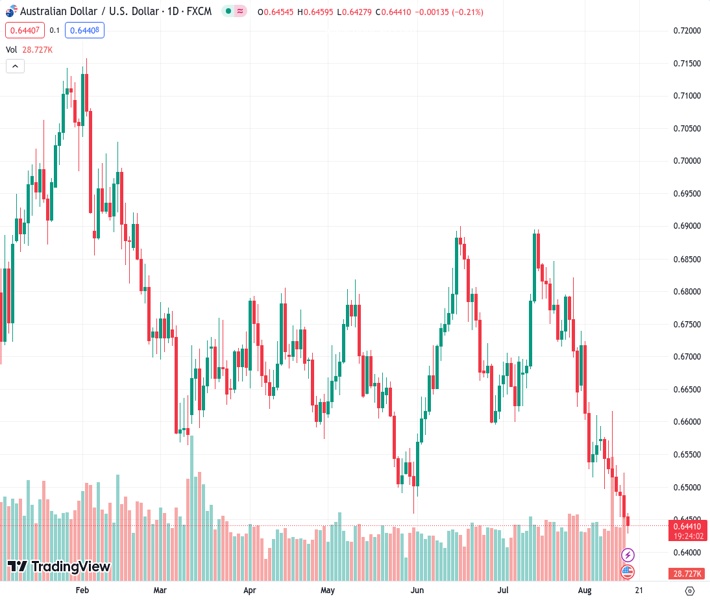
The AUDUSD pair, currently at a rate of 0.64395, has experienced a significant decline over the past week, reaching its lowest point of the year. However, the outlook from @nehcap suggests that the potential for further decline is limited.
…
This is a premium post.
[s2If !current_user_can(access_s2member_level4)]Please register for FREE REGISTER to read full post below containing analysis. In case of any error or you think you are not able to read the full post below, please email us at support#nehcap.com [lwa][/s2If] [s2If current_user_can(access_s2member_level1)]
- AUD/USD takes offers to refresh yearly bottom during seven-day downtrend.
The pair currently trades last at 0.64395.
The previous day high was 0.6522 while the previous day low was 0.6452. The daily 38.2% Fib levels comes at 0.6478, expected to provide resistance. Similarly, the daily 61.8% fib level is at 0.6495, expected to provide resistance.
AUD/USD stands on slippery grounds near 0.6430 as it renews the Year-To-Date (YTD) low during the seven-day losing streak early Wednesday. In doing so, the Aussie pair justifies its risk barometer status ahead of the Federal Reserve (Fed) monetary policy meeting minutes.
Adding strength to the downside bias are the bearish MACD signals and the quote’s clear break of the previous key support line stretched from October 2022. Furthermore, Aussie pair’s sustained below the 10-DMA and a one-month-old descending trend line also favors the AUD/USD sellers.
However, the oversold conditions of the RSI (14) and likely disappointment for the US Dollar hawks from the Fed Minutes seem to prod the AUD/USD sellers as they approach a downward-sloping support line from March, close to 0.6410 at the latest.
In a case where the AUD/USD ignores RSI and justifies hawkish Fed Minutes, if any, the quote is likely to slump towards the late 2022 bottom of around 0.6170.
On the other hand, the 10-DMA restricts the immediate recovery of the Aussie pair near 0.6515.
However, a convergence of the 61.8% Fibonacci retracement of October 2022 to February 2023 upside, a 10-month-old previous support line and a downward-sloping trend line from July 18 together constitute 0.6545-50 key resistance for the pair buyers to watch during the quote’s rebound.
Should the quote manages to stay firmer past 0.6550, lows marked during late June and early July around the 0.6600 mark will act as the last defense of the Aussie bears.
Trend: Limited downside expected
Technical Levels: Supports and Resistances
AUDUSD currently trading at 0.6436 at the time of writing. Pair opened at 0.6455 and is trading with a change of -0.29% % .
| Overview | Overview.1 | |
|---|---|---|
| 0 | Today last price | 0.6436 |
| 1 | Today Daily Change | -0.0019 |
| 2 | Today Daily Change % | -0.29% |
| 3 | Today daily open | 0.6455 |
The pair remains strongly bearish on the daily time frame. It trades below the 20 SMA @ 0.6626, 50 SMA 0.6693, 100 SMA @ 0.6678 and 200 SMA @ 0.6737.
| Trends | Trends.1 | |
|---|---|---|
| 0 | Daily SMA20 | 0.6626 |
| 1 | Daily SMA50 | 0.6693 |
| 2 | Daily SMA100 | 0.6678 |
| 3 | Daily SMA200 | 0.6737 |
The previous day high was 0.6522 while the previous day low was 0.6452. The daily 38.2% Fib levels comes at 0.6478, expected to provide resistance. Similarly, the daily 61.8% fib level is at 0.6495, expected to provide resistance.
Note the levels of interest below:
- Pivot support is noted at 0.643, 0.6405, 0.6359
- Pivot resistance is noted at 0.6501, 0.6547, 0.6571
| Levels | Levels.1 |
|---|---|
| Previous Daily High | 0.6522 |
| Previous Daily Low | 0.6452 |
| Previous Weekly High | 0.6617 |
| Previous Weekly Low | 0.6486 |
| Previous Monthly High | 0.6895 |
| Previous Monthly Low | 0.6599 |
| Daily Fibonacci 38.2% | 0.6478 |
| Daily Fibonacci 61.8% | 0.6495 |
| Daily Pivot Point S1 | 0.6430 |
| Daily Pivot Point S2 | 0.6405 |
| Daily Pivot Point S3 | 0.6359 |
| Daily Pivot Point R1 | 0.6501 |
| Daily Pivot Point R2 | 0.6547 |
| Daily Pivot Point R3 | 0.6571 |
[/s2If]
Download Nehcap EAWe have two EAs that are operational on our LIVE accounts.
- EA-FIX: Check out the details here. Download EA-FIX . EA-FIX is a non-grid HFT scalper.
- EA-GROWTH: High quality low dd EA using trend grids. Download EA_GROWTHJoin Our Telegram Group
")


