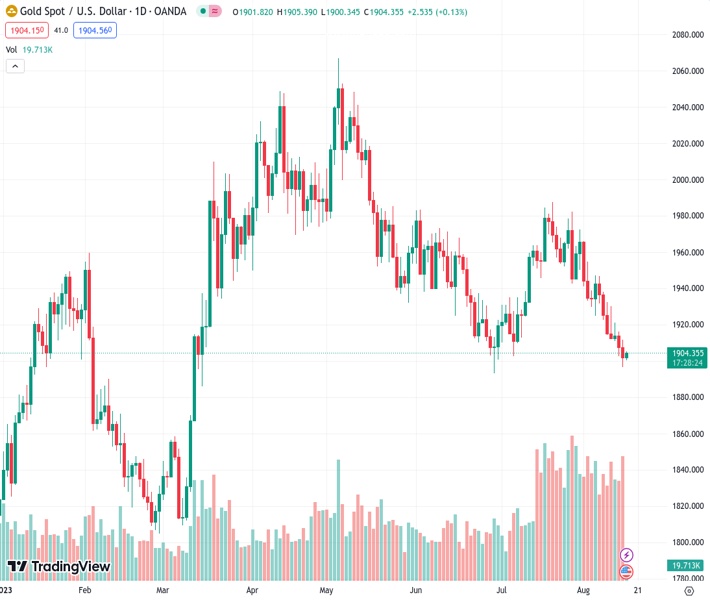
Gold at $1,904.74 maintains its position following positive US Retail Sales data announced on Tuesday.
…
This is a premium post.
[s2If !current_user_can(access_s2member_level4)]Please register for FREE REGISTER to read full post below containing analysis. In case of any error or you think you are not able to read the full post below, please email us at support#nehcap.com [lwa][/s2If] [s2If current_user_can(access_s2member_level1)]
- XAU/USD holds ground after upbeat US Retail Sales released on Tuesday.
The pair currently trades last at 1904.74.
The previous day high was 1911.77 while the previous day low was 1896.49. The daily 38.2% Fib levels comes at 1902.33, expected to provide support. Similarly, the daily 61.8% fib level is at 1905.93, expected to provide resistance.
Gold price (XAU/USD) hovers around the $1,901 mark during the Asian trading session on Wednesday. An upbeat United States (US) Retail Sales have raised concerns over further tightening of monetary policy by the US Federal Reserve (Fed) weighed on XAU/USD the previous day.
The stronger-than-expected US Retail Sales data for July, with a 0.7% increase compared to the previous reading of 0.3% and beating the market expectation of 0.4%, which indicates a healthier and more robust US economy. This could lead to speculations that the US Federal Reserve (Fed), might consider tightening its monetary policy in the September meeting, which might weaken the appeal of non-interest-bearing assets like Gold.
The concerns about China’s weakening economic outlook are putting pressure on Gold’s ability to sustain its value. On Tuesday, an unexpected decision by China’s central bank to reduce one-year medium-term lending facility (MLF) loans by 15 basis points (bps) to 2.50% from 2.65% prior might intensify the pressure on the price of Gold. Additionally, China’s downbeat July Retail Sales rose 2.5% YoY vs. 4.8% expected and 3.1% previous, as well as the Industrial Production that came in at 3.7% YoY vs. 4.5% estimated and 4.4% prior.
The US Dollar Index (DXY), which measures the strength of the US Dollar (USD) against a basket of six major currencies, continues its winning streak for the fifth consecutive day. Currently, the DXY is trading around 103.20. This upward movement of the US Dollar (USD) is a result of strong economic data originating from the United States (US). Positive economic indicators have the potential to drive up demand for the USD in comparison to XAU (Gold).
Technical Levels: Supports and Resistances
XAUUSD currently trading at 1904.74 at the time of writing. Pair opened at 1901.84 and is trading with a change of 0.15 % .
| Overview | Overview.1 | |
|---|---|---|
| 0 | Today last price | 1904.74 |
| 1 | Today Daily Change | 2.90 |
| 2 | Today Daily Change % | 0.15 |
| 3 | Today daily open | 1901.84 |
The pair is trading below its 20 Daily moving average @ 1941.87, below its 50 Daily moving average @ 1939.06 , below its 100 Daily moving average @ 1965.14 and above its 200 Daily moving average @ 1904.22
| Trends | Trends.1 | |
|---|---|---|
| 0 | Daily SMA20 | 1941.87 |
| 1 | Daily SMA50 | 1939.06 |
| 2 | Daily SMA100 | 1965.14 |
| 3 | Daily SMA200 | 1904.22 |
The previous day high was 1911.77 while the previous day low was 1896.49. The daily 38.2% Fib levels comes at 1902.33, expected to provide support. Similarly, the daily 61.8% fib level is at 1905.93, expected to provide resistance.
Note the levels of interest below:
- Pivot support is noted at 1894.96, 1888.09, 1879.68
- Pivot resistance is noted at 1910.24, 1918.65, 1925.52
| Levels | Levels.1 |
|---|---|
| Previous Daily High | 1911.77 |
| Previous Daily Low | 1896.49 |
| Previous Weekly High | 1946.82 |
| Previous Weekly Low | 1910.92 |
| Previous Monthly High | 1987.54 |
| Previous Monthly Low | 1902.77 |
| Daily Fibonacci 38.2% | 1902.33 |
| Daily Fibonacci 61.8% | 1905.93 |
| Daily Pivot Point S1 | 1894.96 |
| Daily Pivot Point S2 | 1888.09 |
| Daily Pivot Point S3 | 1879.68 |
| Daily Pivot Point R1 | 1910.24 |
| Daily Pivot Point R2 | 1918.65 |
| Daily Pivot Point R3 | 1925.52 |
[/s2If]
Download Nehcap EAWe have two EAs that are operational on our LIVE accounts.
- EA-FIX: Check out the details here. Download EA-FIX . EA-FIX is a non-grid HFT scalper.
- EA-GROWTH: High quality low dd EA using trend grids. Download EA_GROWTHJoin Our Telegram Group
")


