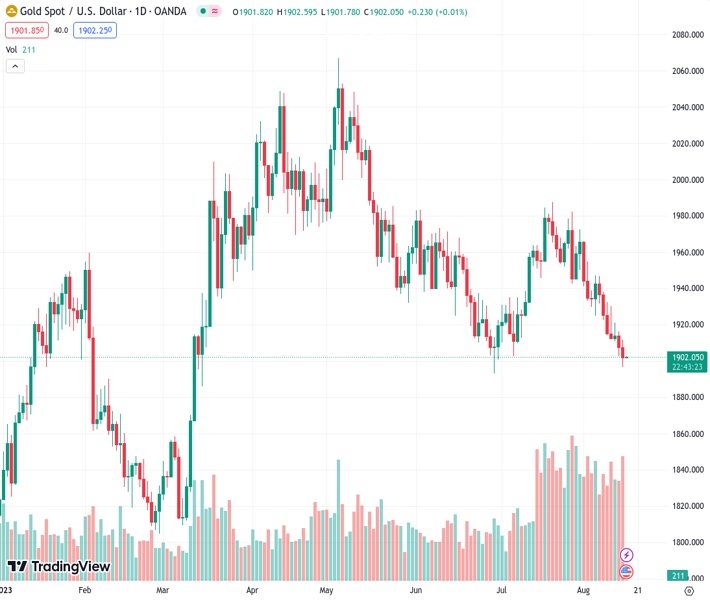
The value of XAUUSD at 1,902.00 dropped close to the $1,900 area, going under the 200-day Simple Moving Average.
…
This is a premium post.
[s2If !current_user_can(access_s2member_level4)]Please register for FREE REGISTER to read full post below containing analysis. In case of any error or you think you are not able to read the full post below, please email us at support#nehcap.com [lwa][/s2If] [s2If current_user_can(access_s2member_level1)]
- XAU/USD fell near the $1,900 zone, below the 200-day SMA.
The pair currently trades last at 1902.00.
The previous day high was 1916.29 while the previous day low was 1902.77. The daily 38.2% Fib levels comes at 1907.93, expected to provide resistance. Similarly, the daily 61.8% fib level is at 1911.13, expected to provide resistance.
In Tuesday’s session, the XAU/USD faced selling pressure, lost the 200-day Simple Moving Average, and fell to $1,900 an ounce. In that sense, bearish pressure can be attributed to markets gearing up for another Federal Reserve (Fed), not in September but in November. The latest data revealed that the headline and core Consumer Price Index (CPI) decelerated in July, but the Producer Price Index (PPI) accelerated. In addition, July’s Retail Sales from the US were reported to have increased higher than expected.
As for now, according to the CME FedWatch tool, markets discount low odds of a hike in the upcoming September meeting, but the odds of a hike in November rise nearly 40%. In that sense, the July meeting’s Federal Open Market Committee (FOMC) minutes will help investors model their expectations.
The daily chart analysis indicated that the XAU/USD has a bearish technical bias for the short term, with Relative Strength Index (RSI) and Moving Average Convergence Divergence (MACD) residing in negative territory. The RSI also exhibits a southward slope below its midline, emphasising the presence of intense selling pressure, while the MACD, with its red bars, highlights the strengthening bearish momentum for the XAU/USD. Furthermore, the pair is below the 20,100 and 200-day Simple Moving Averages (SMAs), indicating that the sellers dominate the broader perspective.
Support levels: $1,890, $1,870, $1,850
Resistance levels: $1,905 (200-day SMA), $1,930, $1,950.
Technical Levels: Supports and Resistances
XAUUSD currently trading at 1901.84 at the time of writing. Pair opened at 1907.18 and is trading with a change of -0.28 % .
| Overview | Overview.1 | |
|---|---|---|
| 0 | Today last price | 1901.84 |
| 1 | Today Daily Change | -5.34 |
| 2 | Today Daily Change % | -0.28 |
| 3 | Today daily open | 1907.18 |
The pair remains strongly bearish on the daily time frame. It trades below the 20 SMA @ 1945.72, 50 SMA 1940.29, 100 SMA @ 1965.69 and 200 SMA @ 1903.09.
| Trends | Trends.1 | |
|---|---|---|
| 0 | Daily SMA20 | 1945.72 |
| 1 | Daily SMA50 | 1940.29 |
| 2 | Daily SMA100 | 1965.69 |
| 3 | Daily SMA200 | 1903.09 |
The previous day high was 1916.29 while the previous day low was 1902.77. The daily 38.2% Fib levels comes at 1907.93, expected to provide resistance. Similarly, the daily 61.8% fib level is at 1911.13, expected to provide resistance.
Note the levels of interest below:
- Pivot support is noted at 1901.2, 1895.23, 1887.68
- Pivot resistance is noted at 1914.72, 1922.27, 1928.24
| Levels | Levels.1 |
|---|---|
| Previous Daily High | 1916.29 |
| Previous Daily Low | 1902.77 |
| Previous Weekly High | 1946.82 |
| Previous Weekly Low | 1910.92 |
| Previous Monthly High | 1987.54 |
| Previous Monthly Low | 1902.77 |
| Daily Fibonacci 38.2% | 1907.93 |
| Daily Fibonacci 61.8% | 1911.13 |
| Daily Pivot Point S1 | 1901.20 |
| Daily Pivot Point S2 | 1895.23 |
| Daily Pivot Point S3 | 1887.68 |
| Daily Pivot Point R1 | 1914.72 |
| Daily Pivot Point R2 | 1922.27 |
| Daily Pivot Point R3 | 1928.24 |
[/s2If]
Download Nehcap EAWe have two EAs that are operational on our LIVE accounts.
- EA-FIX: Check out the details here. Download EA-FIX . EA-FIX is a non-grid HFT scalper.
- EA-GROWTH: High quality low dd EA using trend grids. Download EA_GROWTHJoin Our Telegram Group
")


