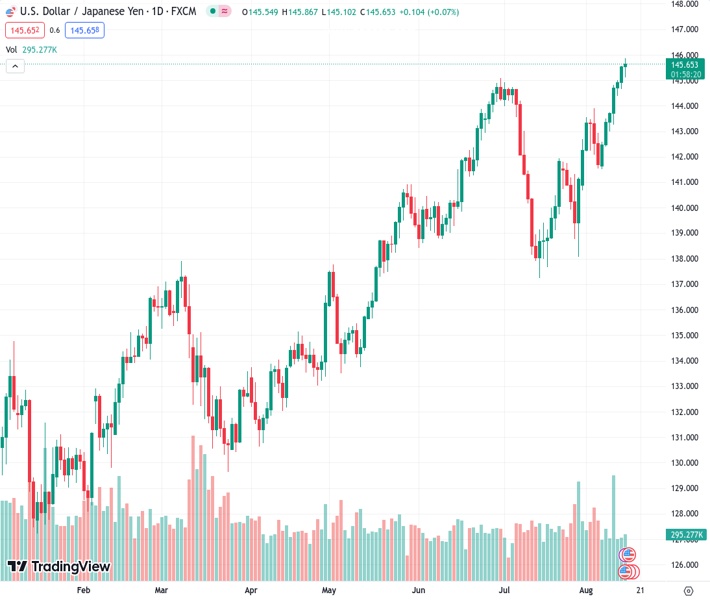
The USDJPY currency pair is currently trading in a neutral position around the 145.55 level, following a drop to 145.10.
…
This is a premium post.
[s2If !current_user_can(access_s2member_level4)]Please register for FREE REGISTER to read full post below containing analysis. In case of any error or you think you are not able to read the full post below, please email us at support#nehcap.com [lwa][/s2If] [s2If current_user_can(access_s2member_level1)]
- USD/JPY trades neutral at the 145.55 area after hitting a low of 145.10.
The pair currently trades last at 145.651.
The previous day high was 145.58 while the previous day low was 144.65. The daily 38.2% Fib levels comes at 145.23, expected to provide support. Similarly, the daily 61.8% fib level is at 145.01, expected to provide support.
On Tuesday, the USD/JPY traded flat while the USD seemed to consolidate. On the other hand, the JPY continues to trade vulnerable amid the extreme dovish stance of the Bank of Japan (BoJ) and monetary policy divergence between its peers.
US Retail Sales revealed that the US economy is holding strong. The headline Sales increased by 0.7% MoM, higher than the 0.4% expected, while the ones excluding the Automobile sector also came in strong and came in at 1% vs the 0.4% expected.
Regarding the next Federal Reserve (Fed) meeting, there’s a prevailing market expectation of a no hike in September. However, the chances of a 25 basis point adjustment in November reach a peak of around 40%. That said, the focus now pivots to Wednesday’s Federal Open Market Committee (FOMC) gathering, as investors seek hints in the forward guidance to attain a distinct perspective on the officials’ position.
Despite reporting strong Gross Domestic Product (GDP) data, the JPY continues to trade weak. On Tuesday, it was reported that during the second quarter, the economy expanded by 1.5% QoQ at a 6% annualised pace in both figures. On the bright side, speculations of a potential Bank of Japan (BoJ) intervention to stop the currency’s loss is the only hope for the Yen while the USD/JPY consolidated above the 145.00 level.
The technical analysis of the daily chart supports a bullish view of USD/JPY in the short term. The relative Strength Index (RSI) maintains its favourable position above the midline, displaying an upward inclination. Moreover, Moving Average Convergence Divergence (MACD) showcases green bars, underlining the strengthening bullish momentum. Furthermore, the pair is above the 20,100,200-day SMAs, suggesting that the bulls are firmly in control of the bigger picture.
Support levels: 145.00, 144.70, 144.00.
Resistance levels: 145.70, 146.00, 146.50.
Technical Levels: Supports and Resistances
USDJPY currently trading at 145.54 at the time of writing. Pair opened at 145.55 and is trading with a change of -0.01 % .
| Overview | Overview.1 | |
|---|---|---|
| 0 | Today last price | 145.54 |
| 1 | Today Daily Change | -0.01 |
| 2 | Today Daily Change % | -0.01 |
| 3 | Today daily open | 145.55 |
The pair remains strongly bullish on the daily timeframe. It trades above its 20 SMA @ 142.09, 50 SMA 141.82, 100 SMA @ 138.65 and 200 SMA @ 136.47.
| Trends | Trends.1 | |
|---|---|---|
| 0 | Daily SMA20 | 142.09 |
| 1 | Daily SMA50 | 141.82 |
| 2 | Daily SMA100 | 138.65 |
| 3 | Daily SMA200 | 136.47 |
The previous day high was 145.58 while the previous day low was 144.65. The daily 38.2% Fib levels comes at 145.23, expected to provide support. Similarly, the daily 61.8% fib level is at 145.01, expected to provide support.
Note the levels of interest below:
- Pivot support is noted at 144.94, 144.33, 144.02
- Pivot resistance is noted at 145.87, 146.19, 146.8
| Levels | Levels.1 |
|---|---|
| Previous Daily High | 145.58 |
| Previous Daily Low | 144.65 |
| Previous Weekly High | 145.00 |
| Previous Weekly Low | 141.51 |
| Previous Monthly High | 144.91 |
| Previous Monthly Low | 137.24 |
| Daily Fibonacci 38.2% | 145.23 |
| Daily Fibonacci 61.8% | 145.01 |
| Daily Pivot Point S1 | 144.94 |
| Daily Pivot Point S2 | 144.33 |
| Daily Pivot Point S3 | 144.02 |
| Daily Pivot Point R1 | 145.87 |
| Daily Pivot Point R2 | 146.19 |
| Daily Pivot Point R3 | 146.80 |
[/s2If]
Download Nehcap EAWe have two EAs that are operational on our LIVE accounts.
- EA-FIX: Check out the details here. Download EA-FIX . EA-FIX is a non-grid HFT scalper.
- EA-GROWTH: High quality low dd EA using trend grids. Download EA_GROWTHJoin Our Telegram Group
")


