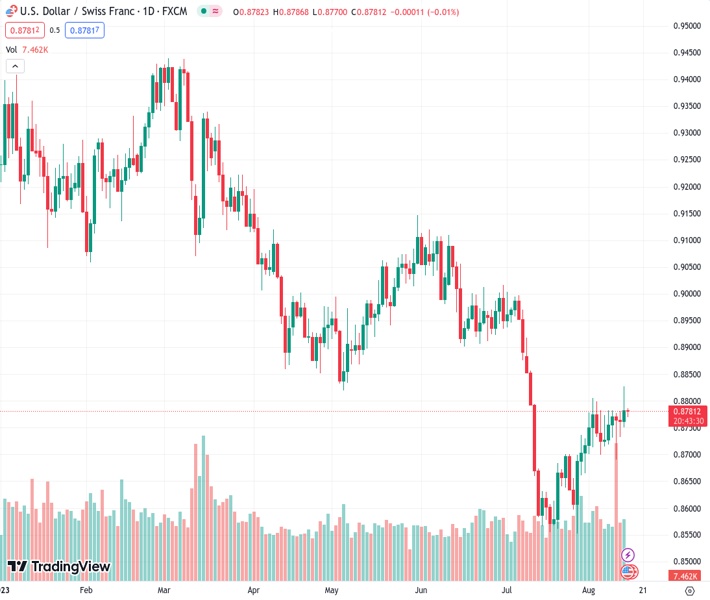
The USDCHF pair is currently trading horizontally below the 0.8800 level, following a decline from its highest point in several weeks during the early Asian session.
…
This is a premium post.
[s2If !current_user_can(access_s2member_level4)]Please register for FREE REGISTER to read full post below containing analysis. In case of any error or you think you are not able to read the full post below, please email us at support#nehcap.com [lwa][/s2If] [s2If current_user_can(access_s2member_level1)]
- USD/CHF trades sideways below the 0.8800 barrier after retreating from a multi-week high in the early Asian session.
The pair currently trades last at 0.87807.
The previous day high was 0.8781 while the previous day low was 0.8735. The daily 38.2% Fib levels comes at 0.8753, expected to provide support. Similarly, the daily 61.8% fib level is at 0.8763, expected to provide support.
The USD/CHF pair holds ground around 0.8782 during the early Asian session on Tuesday. The pair remains sideways after retreating from multi-week high of 0.8827. Meanwhile, the US Dollar Index (DXY), a measure of the value of the USD against six other major currencies, trades The major pair remains capped around the 0.8800 barrier ahead of the Swiss Producer and Import Price Index for July and the US Retail Sales data.
Investors anticipate that the Federal Reserve (Fed) will keep the interest rate unchanged in its September meeting, but the possibility for an additional rate hike of 25 basis points (bps) increased to almost 40% in November. However, interest rates will stay high for longer in order to assure the return of inflation to 2%. This would maintain recession concerns. Market players will take more cues from US Retail Sales in July due on Tuesday and FOMC Minutes due later on Thursday. A more hawkish stance by the Fed might lift the US Dollar against its rivals.
On the other hand, market players is expected that the Swiss National Bank (SNB) will raise interest rates by 25 basis points (bps) to 2% in September, according to Bllomberg. About the data, the Swiss Unemployment Rate came in at 1.9% in July, matching expectations. The figure remained unchanged compared to the June reading and marked its lowest level since October 2022.
Furthermore, the headling surrounding the US-China relationship remains in focus. As a result of President Joe Biden’s decision to restrict certain US technology investments in China, US investors have expressed concern that Beijing may retaliate or cease purchasing American technology. The renewed trade tension might benefit the safe-haven Swiss Franc and act as a headwind for the USD/CHF pair.
Moving on, the Swiss Federal Statistical Office will release the Producer and Import Prices on Tuesday. Meanwhile, US Retail Sales will be due later in the day. The monthly figure is expected to rise from 0.2% to 0.4% in July. Market participants will also monitor the FOMC minutes and the Fed officials’s comments for the Jackson Hole Symposium. Traders will take cues from the data and find trading opportunities around the USD/CHF pair.
Technical Levels: Supports and Resistances
USDCHF currently trading at 0.8783 at the time of writing. Pair opened at 0.8765 and is trading with a change of 0.21 % .
| Overview | Overview.1 | |
|---|---|---|
| 0 | Today last price | 0.8783 |
| 1 | Today Daily Change | 0.0018 |
| 2 | Today Daily Change % | 0.2100 |
| 3 | Today daily open | 0.8765 |
The pair is trading above its 20 Daily moving average @ 0.8697, below its 50 Daily moving average @ 0.8842 , below its 100 Daily moving average @ 0.8921 and below its 200 Daily moving average @ 0.9124
| Trends | Trends.1 | |
|---|---|---|
| 0 | Daily SMA20 | 0.8697 |
| 1 | Daily SMA50 | 0.8842 |
| 2 | Daily SMA100 | 0.8921 |
| 3 | Daily SMA200 | 0.9124 |
The previous day high was 0.8781 while the previous day low was 0.8735. The daily 38.2% Fib levels comes at 0.8753, expected to provide support. Similarly, the daily 61.8% fib level is at 0.8763, expected to provide support.
Note the levels of interest below:
- Pivot support is noted at 0.874, 0.8715, 0.8695
- Pivot resistance is noted at 0.8786, 0.8806, 0.8831
| Levels | Levels.1 |
|---|---|
| Previous Daily High | 0.8781 |
| Previous Daily Low | 0.8735 |
| Previous Weekly High | 0.8783 |
| Previous Weekly Low | 0.8690 |
| Previous Monthly High | 0.9005 |
| Previous Monthly Low | 0.8552 |
| Daily Fibonacci 38.2% | 0.8753 |
| Daily Fibonacci 61.8% | 0.8763 |
| Daily Pivot Point S1 | 0.8740 |
| Daily Pivot Point S2 | 0.8715 |
| Daily Pivot Point S3 | 0.8695 |
| Daily Pivot Point R1 | 0.8786 |
| Daily Pivot Point R2 | 0.8806 |
| Daily Pivot Point R3 | 0.8831 |
[/s2If]
Download Nehcap EAWe have two EAs that are operational on our LIVE accounts.
- EA-FIX: Check out the details here. Download EA-FIX . EA-FIX is a non-grid HFT scalper.
- EA-GROWTH: High quality low dd EA using trend grids. Download EA_GROWTHJoin Our Telegram Group
")


