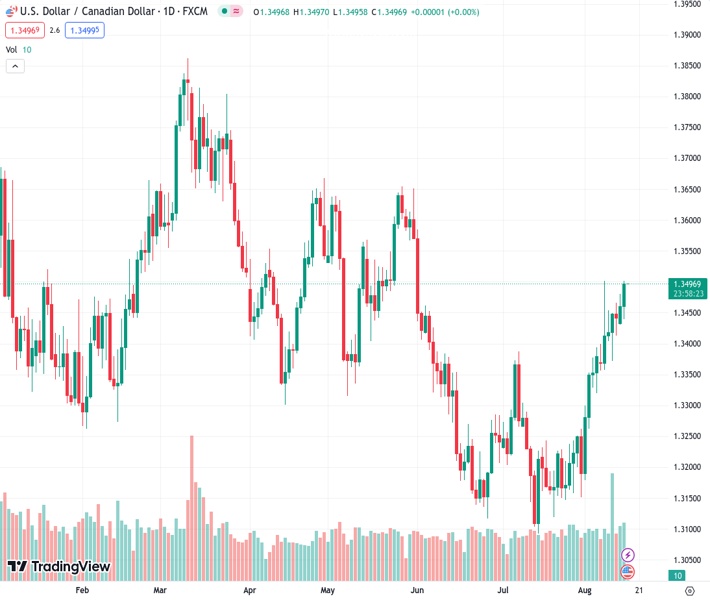
The USDCAD pair is approaching overbought territory as it hovers around the 1.3500 area, indicating a daily increase of over 0.30%.
…
This is a premium post.
[s2If !current_user_can(access_s2member_level4)]Please register for FREE REGISTER to read full post below containing analysis. In case of any error or you think you are not able to read the full post below, please email us at support#nehcap.com [lwa][/s2If] [s2If current_user_can(access_s2member_level1)]
- The pair is about to reach overbought conditions, trading around the 1.3500 zone, showing more than 0.30% of daily gains.
The pair currently trades last at 1.34982.
The previous day high was 1.348 while the previous day low was 1.3437. The daily 38.2% Fib levels comes at 1.3463, expected to provide support. Similarly, the daily 61.8% fib level is at 1.3453, expected to provide support.
The USD/CAD saw green on Tuesday and increased near highs since early June, trading around 1.3500. On the one hand, the optimistic US Retail Sales from July made the market discount a more aggressive bet by the Federal Reserve (Fed) and favoured the USD. On the other hand, the Consumer Price Index (CPI) from July came in higher than expected, favouring the Canadian dollar, while lower Oil prices limited the upside potential.
Canadian inflation for July came in hot. The Consumer Price Index (CPI), advanced 0.3% Mom while the annualised measure accelerated to 3.2%, higher than the 3% expected and the previous 2.8%. The Core figure rose to 3.2% vs the 2.8% expected from the last 2.8%.
Regarding the next Bank of Canada (BoC), according to the World Interest Rate Possibilities (WIRP) tool, markets discount high odds of a 25% chance of a hike on September 6 and then increase to approximately 55% by October 25. Looking further ahead, it climbs to about 60% by December 6. In that sense, hawkish bets on the BoC may support the CAD in the following sessions.
On the other hand, July’s US Retail Sales exceeded expectations. The headline rose by 0.7% MoM, higher than the 0.4% expected. Sales Excluding the Automobile sector also met expectations and came in at 1% vs the 0.4% expected. The USD gained some momentum as a reaction, but the DXY traded relatively flat during the session. With that said, attention now turns to the Federal Open Market Committee (FOMC) meeting minutes released scheduled for Wednesday, where investors will look for clues regarding the Federal Reserve’s (Fed) next steps. As for now, the stronger case, according to the CME FedWatch tool, is that the Fed will skip in September and then hike in November by 25 basis points (bps)
According to the daily chart analysis, short-term prospects for USD/CAD look bullish. Both Relative Strength Index (RSI) and Moving Average Convergence Divergence (MACD) remain positive and are near overbought conditions. Moreover, the pair is above the 20,100,200-day Simple Moving Averages (SMA), indicating that the buyers command the broader perspective.
Support levels: 1.3450 (200-day SMA), 1.3400, 1.3380 (100-day SMA).
Resistance levels: 1.3510, 1.3550, 1.3570.
Technical Levels: Supports and Resistances
USDCAD currently trading at 1.35 at the time of writing. Pair opened at 1.3461 and is trading with a change of 0.29 % .
| Overview | Overview.1 | |
|---|---|---|
| 0 | Today last price | 1.3500 |
| 1 | Today Daily Change | 0.0039 |
| 2 | Today Daily Change % | 0.2900 |
| 3 | Today daily open | 1.3461 |
The pair remains strongly bullish on the daily timeframe. It trades above its 20 SMA @ 1.3293, 50 SMA 1.3269, 100 SMA @ 1.3386 and 200 SMA @ 1.345.
| Trends | Trends.1 | |
|---|---|---|
| 0 | Daily SMA20 | 1.3293 |
| 1 | Daily SMA50 | 1.3269 |
| 2 | Daily SMA100 | 1.3386 |
| 3 | Daily SMA200 | 1.3450 |
The previous day high was 1.348 while the previous day low was 1.3437. The daily 38.2% Fib levels comes at 1.3463, expected to provide support. Similarly, the daily 61.8% fib level is at 1.3453, expected to provide support.
Note the levels of interest below:
- Pivot support is noted at 1.3438, 1.3416, 1.3395
- Pivot resistance is noted at 1.3482, 1.3502, 1.3525
| Levels | Levels.1 |
|---|---|
| Previous Daily High | 1.3480 |
| Previous Daily Low | 1.3437 |
| Previous Weekly High | 1.3502 |
| Previous Weekly Low | 1.3356 |
| Previous Monthly High | 1.3387 |
| Previous Monthly Low | 1.3093 |
| Daily Fibonacci 38.2% | 1.3463 |
| Daily Fibonacci 61.8% | 1.3453 |
| Daily Pivot Point S1 | 1.3438 |
| Daily Pivot Point S2 | 1.3416 |
| Daily Pivot Point S3 | 1.3395 |
| Daily Pivot Point R1 | 1.3482 |
| Daily Pivot Point R2 | 1.3502 |
| Daily Pivot Point R3 | 1.3525 |
[/s2If]
Download Nehcap EAWe have two EAs that are operational on our LIVE accounts.
- EA-FIX: Check out the details here. Download EA-FIX . EA-FIX is a non-grid HFT scalper.
- EA-GROWTH: High quality low dd EA using trend grids. Download EA_GROWTHJoin Our Telegram Group
")


