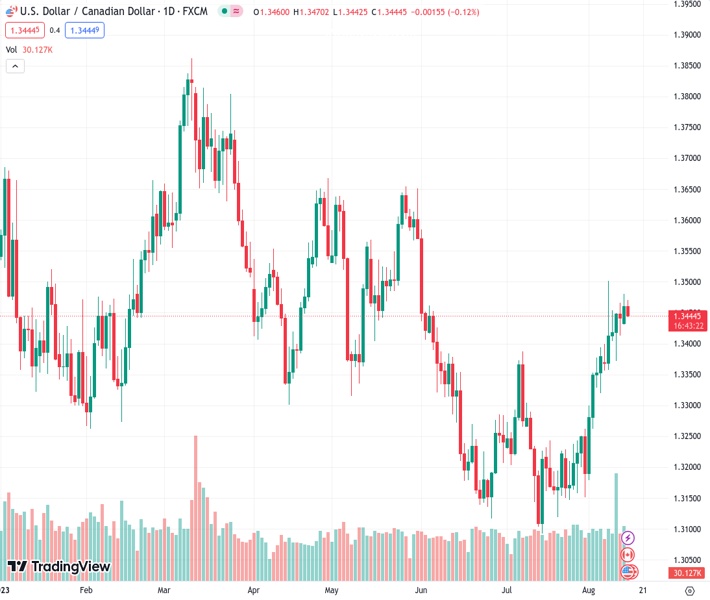
The US dollar to Canadian dollar exchange rate, currently at 1.34445, slightly decreases on Tuesday due to a small decrease in the value of the US dollar.
…
This is a premium post.
[s2If !current_user_can(access_s2member_level4)]Please register for FREE REGISTER to read full post below containing analysis. In case of any error or you think you are not able to read the full post below, please email us at support#nehcap.com [lwa][/s2If] [s2If current_user_can(access_s2member_level1)]
- USD/CAD edges lower on Tuesday and is weighed down by a modest USD weakness.
The pair currently trades last at 1.34445.
The previous day high was 1.348 while the previous day low was 1.3437. The daily 38.2% Fib levels comes at 1.3463, expected to provide resistance. Similarly, the daily 61.8% fib level is at 1.3453, expected to provide resistance.
The USD/CAD pair meets with some supply during the Asian session on Tuesday and erodes a major part of the overnight gains to a multi-day peak. Spot prices drop to a fresh daily low, below mid-1.3400s in the last hour and the intraday downtick could be solely attributed to some repositioning trade ahead of the latest Canadian consumer inflation figures, due for release later during the early North American session.
Apart from this, traders will take cues from the US macro data – monthly Retail Sales figures and the Empire State Manufacturing Index. In the meantime, a mildly softer tone surrounding the US Dollar (USD) is seen as another factor exerting some downward pressure on the USD/CAD pair. That said, any meaningful USD corrective pullback from over a two-month high touched on Monday seems elusive in the wake of growing acceptance that the Federal Reserve (Fed) will stick to its hawkish stance and keep interest rates higher for longer.
Furthermore, concerns about the worsening economic conditions in China should act as a tailwind for the safe-haven buck and help limit deeper losses for the USD/CAD pair, at least for now. Meanwhile, subdued Crude Oil prices fail to provide any impetus to the commodity-linked Loonie or influence the major. The technical setup, however, still seems tilted firmly in favour of bullish traders and suggests that the path of least resistance for spot prices is to the upside. Hence, any subsequent decline might still be seen as a buying opportunity.
Last week’s sustained breakout through the 1.3370-1.3380 confluence – comprising the 50% Fibonacci retracement level of the May-July downfall and the 100-day Simple Moving Average (SMA) – was seen as a fresh trigger for bullish traders. Adding to this, the overnight close above the very important 200-day SMA, along with positive oscillators on the daily chart, validates the near-term constructive outlook for the USD/CAD pair. That said, the recent failure near the 1.3500 psychological mark warrants caution before positioning for further gains.
A sustained strength beyond the aforementioned handle should allow the USD/CAD pair to accelerate the momentum towards the next relevant hurdle near the 1.3555-1.3560 region. The upward trajectory could get extended further and eventually lift spot prices towards the 1.3600 round figure.
On the flip side, any further intraday slide is likely to find decent support near the 1.3400-1.3390 confluence resistance breakpoint ahead of the 1.3355 region. This is followed by the 38.2% Fibo. level, around the 1.3315-1.3310 zone, and the 1.3300 mark. A convincing break below the latter might prompt some technical selling and make the USD/CAD pair vulnerable to weaken further below the 1.3250 intermediate support and test the 23.6% Fibo. level, around the 1.3225 region.
Technical Levels: Supports and Resistances
USDCAD currently trading at 1.3443 at the time of writing. Pair opened at 1.3461 and is trading with a change of -0.13 % .
| Overview | Overview.1 | |
|---|---|---|
| 0 | Today last price | 1.3443 |
| 1 | Today Daily Change | -0.0018 |
| 2 | Today Daily Change % | -0.1300 |
| 3 | Today daily open | 1.3461 |
The pair is trading above its 20 Daily moving average @ 1.3293, above its 50 Daily moving average @ 1.3269 , above its 100 Daily moving average @ 1.3386 and below its 200 Daily moving average @ 1.345
| Trends | Trends.1 | |
|---|---|---|
| 0 | Daily SMA20 | 1.3293 |
| 1 | Daily SMA50 | 1.3269 |
| 2 | Daily SMA100 | 1.3386 |
| 3 | Daily SMA200 | 1.3450 |
The previous day high was 1.348 while the previous day low was 1.3437. The daily 38.2% Fib levels comes at 1.3463, expected to provide resistance. Similarly, the daily 61.8% fib level is at 1.3453, expected to provide resistance.
Note the levels of interest below:
- Pivot support is noted at 1.3438, 1.3416, 1.3395
- Pivot resistance is noted at 1.3482, 1.3502, 1.3525
| Levels | Levels.1 |
|---|---|
| Previous Daily High | 1.3480 |
| Previous Daily Low | 1.3437 |
| Previous Weekly High | 1.3502 |
| Previous Weekly Low | 1.3356 |
| Previous Monthly High | 1.3387 |
| Previous Monthly Low | 1.3093 |
| Daily Fibonacci 38.2% | 1.3463 |
| Daily Fibonacci 61.8% | 1.3453 |
| Daily Pivot Point S1 | 1.3438 |
| Daily Pivot Point S2 | 1.3416 |
| Daily Pivot Point S3 | 1.3395 |
| Daily Pivot Point R1 | 1.3482 |
| Daily Pivot Point R2 | 1.3502 |
| Daily Pivot Point R3 | 1.3525 |
[/s2If]
Download Nehcap EAWe have two EAs that are operational on our LIVE accounts.
- EA-FIX: Check out the details here. Download EA-FIX . EA-FIX is a non-grid HFT scalper.
- EA-GROWTH: High quality low dd EA using trend grids. Download EA_GROWTHJoin Our Telegram Group
")


