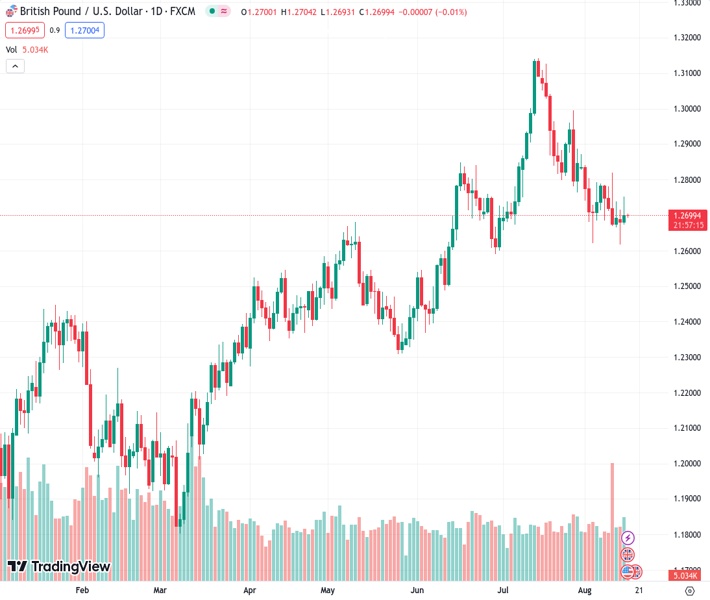
The GBPUSD currency pair, currently trading at 1.26994, has reversed its minor recovery from a six-week low within a short-term consolidation pattern. According to the perspective of Nehcap, it is anticipated that the pair will experience more downward movement.
…
This is a premium post.
[s2If !current_user_can(access_s2member_level4)]Please register for FREE REGISTER to read full post below containing analysis. In case of any error or you think you are not able to read the full post below, please email us at support#nehcap.com [lwa][/s2If] [s2If current_user_can(access_s2member_level1)]
- GBP/USD fades corrective bounce off six-week low within short-term triangle.
The pair currently trades last at 1.26994.
The previous day high was 1.2715 while the previous day low was 1.2617. The daily 38.2% Fib levels comes at 1.2654, expected to provide support. Similarly, the daily 61.8% fib level is at 1.2677, expected to provide support.
GBP/USD retreats to 1.2700 as bulls fail to keep the reins ahead of Wednesday’s top-tier US/UK catalysts, after a surprise entry the previous day.
That said, the Cable pair eases within a 1.5-month-old symmetrical triangle following a corrective bounce after the UK’s latest employment report. It’s worth noting that the Pound Sterling’s latest restoration of the original trend could also be linked to the market’s cautious mood ahead of British inflation data and Monetary Policy Meeting Minutes of the Federal Open Market Committee (FOMC).
Also read: GBP/USD upthrust spurred by UK’s wage growth, despite US retail sales surge
Technically, the GBP/USD pair’s sustained trading below the 200-SMA and failure to defy the stated triangle formation by an upside break of the 1.2750 immediate hurdle favor the sellers. Adding credence to the downside bias is the steady RSI (14) line.
However, the quote needs to provide a successful downside break of the triangle’s bottom line, close to 1.2670 at the latest to convince the sellers.
Even so, the double bottoms around 1.2620 and a two-month-old horizontal area surrounding 1.2600 can test the GBP/USD bears before giving them control.
On the flip side, a clear break of the 1.2750 isn’t enough for the GBP/USD bulls to retake the driver’s seat as the 200-SMA level of around 1.2830 could challenge the upside momentum.
Following that, the Cable pair’s run-up towards the late July peak surrounding the 1.3000 threshold can’t be ruled out.
Trend: Further downside expected
Technical Levels: Supports and Resistances
GBPUSD currently trading at 1.2701 at the time of writing. Pair opened at 1.2684 and is trading with a change of 0.13% % .
| Overview | Overview.1 | |
|---|---|---|
| 0 | Today last price | 1.2701 |
| 1 | Today Daily Change | 0.0017 |
| 2 | Today Daily Change % | 0.13% |
| 3 | Today daily open | 1.2684 |
The pair is trading below its 20 Daily moving average @ 1.2805, below its 50 Daily moving average @ 1.2769 , above its 100 Daily moving average @ 1.2613 and above its 200 Daily moving average @ 1.2357
| Trends | Trends.1 | |
|---|---|---|
| 0 | Daily SMA20 | 1.2805 |
| 1 | Daily SMA50 | 1.2769 |
| 2 | Daily SMA100 | 1.2613 |
| 3 | Daily SMA200 | 1.2357 |
The previous day high was 1.2715 while the previous day low was 1.2617. The daily 38.2% Fib levels comes at 1.2654, expected to provide support. Similarly, the daily 61.8% fib level is at 1.2677, expected to provide support.
Note the levels of interest below:
- Pivot support is noted at 1.2629, 1.2573, 1.253
- Pivot resistance is noted at 1.2727, 1.277, 1.2825
| Levels | Levels.1 |
|---|---|
| Previous Daily High | 1.2715 |
| Previous Daily Low | 1.2617 |
| Previous Weekly High | 1.2819 |
| Previous Weekly Low | 1.2666 |
| Previous Monthly High | 1.3142 |
| Previous Monthly Low | 1.2659 |
| Daily Fibonacci 38.2% | 1.2654 |
| Daily Fibonacci 61.8% | 1.2677 |
| Daily Pivot Point S1 | 1.2629 |
| Daily Pivot Point S2 | 1.2573 |
| Daily Pivot Point S3 | 1.2530 |
| Daily Pivot Point R1 | 1.2727 |
| Daily Pivot Point R2 | 1.2770 |
| Daily Pivot Point R3 | 1.2825 |
[/s2If]
Download Nehcap EAWe have two EAs that are operational on our LIVE accounts.
- EA-FIX: Check out the details here. Download EA-FIX . EA-FIX is a non-grid HFT scalper.
- EA-GROWTH: High quality low dd EA using trend grids. Download EA_GROWTHJoin Our Telegram Group
")


