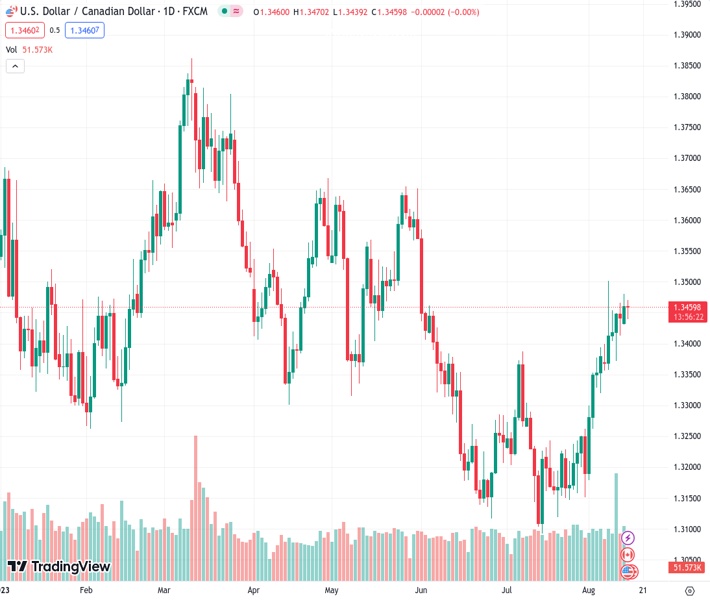
The currency pair USDCAD, currently at a rate of 1.34623, continues to remain unchanged following a recent increase in value. It has managed to recover some of its losses during the day.
…
This is a premium post.
[s2If !current_user_can(access_s2member_level4)]Please register for FREE REGISTER to read full post below containing analysis. In case of any error or you think you are not able to read the full post below, please email us at support#nehcap.com [lwa][/s2If] [s2If current_user_can(access_s2member_level1)]
- USD/CAD remains sidelined after poking monthly high the previous day, pares intraday losses of late.
The pair currently trades last at 1.34623.
The previous day high was 1.348 while the previous day low was 1.3437. The daily 38.2% Fib levels comes at 1.3463, expected to provide resistance. Similarly, the daily 61.8% fib level is at 1.3453, expected to provide support.
USD/CAD clings to mild losses near 1.3450 as it seesaws at the weekly top marked the previous day amid early Tuesday morning in Europe. In doing so, the Loonie pair aptly portrays the cautious mood ahead of the top-tier statistics from the US and Canada.
It’s worth noting that the recent retreat of the US Dollar Index (DXY) contrasts with a pick-up in the WTI crude oil price, Canada’s main export item, to challenge the pair’s upside amid mixed clues.
Having refreshed a five-week high the previous day, the DXY prints the first daily loss in four around 103.05 by the press time, after witnessing downbeat inflation clues. That said, the New York Fed’s one-year inflation expectations eased to 3.5% for July, down three points by falling to the lowest level since April 2021. New York Fed survey, however, also suggested confidence in positive labor market conditions and economic transition.
On the other hand, the WTI crude oil rises 0.40% intraday to $83.25 as it reverses the previous day’s fall to a one-week low. While the US Dollar’s pullback and the market’s cautious optimism can be cited as the key catalysts for the Oil Price rebound, the People’s Bank of China’s (PBoC) surprise rate cuts and readiness for further stimulus adds strength to the black gold’s corrective bounce as Beijing is one of the world’s biggest crude oil customer.
It should be noted that sluggish US Treasury bond yields, after refreshing the yearly top, also prods the USD/CAD buyers. That said, the US 10-year Treasury bond yields seesaw at the highest level since November 2022, marked the previous day, making rounds to 4.20% by the press time. While portraying the mood, stock futures of the US and Europe remain mildly positive and prod the DXY bulls.
Moving forward, the US Retail Sales for July, expected 0.4% MoM versus 0.2% prior, will be important to watch for immediate directions. Also important will be Canada’s Consumer Price Index (CPI) for July and the Bank of Canada (BoC) CPI Core for the said month, not to forget the risk catalysts and the energy market updates.
A five-month-old descending resistance line joins the overbought RSI (14) to challenge the USD/CAD buyers around 1.3465-70.
Technical Levels: Supports and Resistances
USDCAD currently trading at 1.346 at the time of writing. Pair opened at 1.3461 and is trading with a change of -0.01% % .
| Overview | Overview.1 | |
|---|---|---|
| 0 | Today last price | 1.346 |
| 1 | Today Daily Change | -0.0001 |
| 2 | Today Daily Change % | -0.01% |
| 3 | Today daily open | 1.3461 |
The pair remains strongly bullish on the daily timeframe. It trades above its 20 SMA @ 1.3293, 50 SMA 1.3269, 100 SMA @ 1.3386 and 200 SMA @ 1.345.
| Trends | Trends.1 | |
|---|---|---|
| 0 | Daily SMA20 | 1.3293 |
| 1 | Daily SMA50 | 1.3269 |
| 2 | Daily SMA100 | 1.3386 |
| 3 | Daily SMA200 | 1.3450 |
The previous day high was 1.348 while the previous day low was 1.3437. The daily 38.2% Fib levels comes at 1.3463, expected to provide resistance. Similarly, the daily 61.8% fib level is at 1.3453, expected to provide support.
Note the levels of interest below:
- Pivot support is noted at 1.3438, 1.3416, 1.3395
- Pivot resistance is noted at 1.3482, 1.3502, 1.3525
| Levels | Levels.1 |
|---|---|
| Previous Daily High | 1.3480 |
| Previous Daily Low | 1.3437 |
| Previous Weekly High | 1.3502 |
| Previous Weekly Low | 1.3356 |
| Previous Monthly High | 1.3387 |
| Previous Monthly Low | 1.3093 |
| Daily Fibonacci 38.2% | 1.3463 |
| Daily Fibonacci 61.8% | 1.3453 |
| Daily Pivot Point S1 | 1.3438 |
| Daily Pivot Point S2 | 1.3416 |
| Daily Pivot Point S3 | 1.3395 |
| Daily Pivot Point R1 | 1.3482 |
| Daily Pivot Point R2 | 1.3502 |
| Daily Pivot Point R3 | 1.3525 |
[/s2If]
Download Nehcap EAWe have two EAs that are operational on our LIVE accounts.
- EA-FIX: Check out the details here. Download EA-FIX . EA-FIX is a non-grid HFT scalper.
- EA-GROWTH: High quality low dd EA using trend grids. Download EA_GROWTHJoin Our Telegram Group
")


