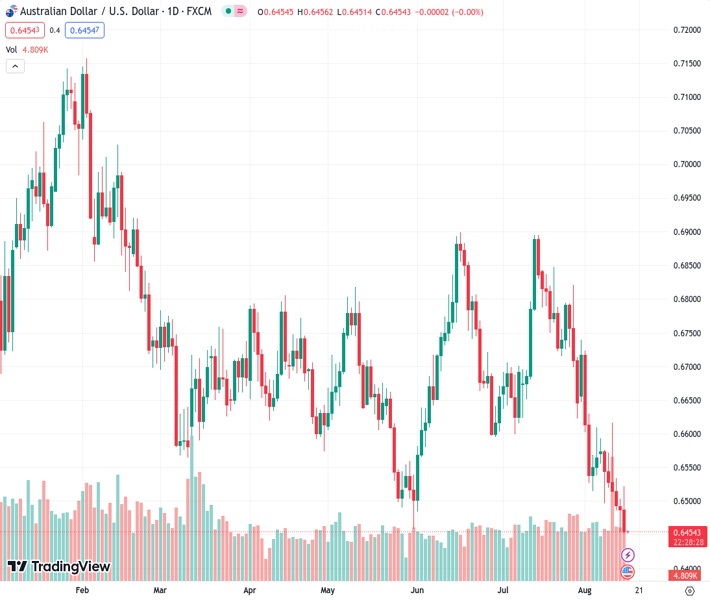
The AUDUSD currency pair is currently trading at 0.64539, and it is recuperating from its recent losses, reaching the lowest level of this year. It has dropped continuously for the past six days.
…
This is a premium post.
[s2If !current_user_can(access_s2member_level4)]Please register for FREE REGISTER to read full post below containing analysis. In case of any error or you think you are not able to read the full post below, please email us at support#nehcap.com [lwa][/s2If] [s2If current_user_can(access_s2member_level1)]
- AUD/USD licks its wounds at the lowest level of the year after falling in the last six consecutive days.
The pair currently trades last at 0.64539.
The previous day high was 0.6507 while the previous day low was 0.6454. The daily 38.2% Fib levels comes at 0.6474, expected to provide resistance. Similarly, the daily 61.8% fib level is at 0.6487, expected to provide resistance.
AUD/USD holds lower grounds at the yearly bottom surrounding 0.6450 as it seeks fresh clues to extend the six-day downtrend amid Wednesday’s Asian session. In doing so, the Aussie pair justifies its risk-barometer catalysts, as well as bears the burden of the downbeat catalysts from home and the biggest customer China, to keep the bears hopeful. However, the market’s cautious mood ahead of the key Monetary Policy Meeting Minutes of the Federal Open Market Committee (FOMC) prod the quote’s further downside near the lowest level since November 2022.
Mixed statements from the Reserve Bank of Australia’s (RBA) Minutes of the August monetary policy meeting join downbeat statistics from Australia and China, as well as fears of another round of rating cut fears, to weigh on the AUD/USD prices. Further, hawkish comments from the Fed official also help the Aussie bears.
Late on Tuesday, Minneapolis Federal Reserve President Neel Kashkari ruled out talks of policy pivot by citing hot inflation and the uncertainty about the Fed’s progress in taming the same. The policymaker also said that he is not ready to say that the Fed is done raising rates, per Reuters.
That said, the market’s risk-off mood preceded the hawkish comments from Kashkari to favor the Aussie sellers. Analysts at the global rating agency Fitch Ratings told CNBC on Tuesday that the agency could downgrade several big lenders, including JPMorgan, as reported by Reuters. The same bolstered the risk-off mood as Wall Street opened, which in turn pared the US Dollar’s initial losses and allowed it to regain upside momentum targeting the monthly high, marked earlier in the week.
It should be observed that the firmer prints of the US Retail Sales for July contrasted with the downbeat US NY Empire State Manufacturing Index for August but managed to strengthen the US Dollar amid the downbeat risk profile. While portraying the mood, Wall Street closed in the red and the US 10-year Treasury bond yields refreshed the yearly high.
At home, the RBA highlighted the fact that a need for further hikes would depend on data and evolving assessment of risks. “Staff inflation forecast had assumed one more hike, rates notably lower than in other countries,” adds the RBA Minutes. Further, the Australian Bureau of Statistics (ABS) unveiled the second-quarter (Q2) Wage Price Index details while suggesting a reprint of 0.8% QoQ figures, versus 1.0% expected, whereas the yearly data eased to 3.6% YoY from 3.7% market forecasts and previous readings.
Talking about China, the People’s Bank of China (PBOC), surprised markets by lowering the one-year Medium-term Lending Facility (MLF) rate to 2.50% from 2.65% previous, as well as by cutting the Reverse Repo Rate to 1.8% from 1.9% previously. Further, China’s July Retail Sales rose 2.5% YoY vs. 4.8% expected and 3.1% previous while the Industrial Production came in at 3.7% YoY vs. 4.5% estimated and 4.4% prior.
Additionally, Reuters cited an anonymous source to state that China’s major state-owned banks were seen selling US Dollars to defend the China Yuan (CNY) in the onshore spot foreign exchange (Forex) market.
At last, China State Bureau Spokesperson ruled out deflation views for China by saying, per Reuters, “There is no deflation in China,” as well as adding that there will be no deflation in the future. The Diplomat also accepted the challenges the economic recovery faces and conveyed expectations that China’s economy to maintain steady operations in the second half of the year.
Looking ahead, Australia’s Westpac Leading Index for July and China’s House Price Index for the said month will precede the monetary policy announcements from the Reserve Bank of New Zealand (RBNZ) to direct AUD/USD moves in Asia. More importantly, the risk catalysts and the Fed Minutes will be crucial to watch for clear directions.
A daily closing beneath May’s low of around 0.6460 and sustained trading below a one-month-old falling resistance line, around 0.6560 by the press time, keeps the AUD/USD bears hopeful of witnessing further downside towards the mid-November 2022 swing low of around 0.6385.
Technical Levels: Supports and Resistances
AUDUSD currently trading at 0.6456 at the time of writing. Pair opened at 0.6487 and is trading with a change of -0.48% % .
| Overview | Overview.1 | |
|---|---|---|
| 0 | Today last price | 0.6456 |
| 1 | Today Daily Change | -0.0031 |
| 2 | Today Daily Change % | -0.48% |
| 3 | Today daily open | 0.6487 |
The pair remains strongly bearish on the daily time frame. It trades below the 20 SMA @ 0.6644, 50 SMA 0.6697, 100 SMA @ 0.668 and 200 SMA @ 0.6737.
| Trends | Trends.1 | |
|---|---|---|
| 0 | Daily SMA20 | 0.6644 |
| 1 | Daily SMA50 | 0.6697 |
| 2 | Daily SMA100 | 0.6680 |
| 3 | Daily SMA200 | 0.6737 |
The previous day high was 0.6507 while the previous day low was 0.6454. The daily 38.2% Fib levels comes at 0.6474, expected to provide resistance. Similarly, the daily 61.8% fib level is at 0.6487, expected to provide resistance.
Note the levels of interest below:
- Pivot support is noted at 0.6458, 0.643, 0.6405
- Pivot resistance is noted at 0.6511, 0.6536, 0.6565
| Levels | Levels.1 |
|---|---|
| Previous Daily High | 0.6507 |
| Previous Daily Low | 0.6454 |
| Previous Weekly High | 0.6617 |
| Previous Weekly Low | 0.6486 |
| Previous Monthly High | 0.6895 |
| Previous Monthly Low | 0.6599 |
| Daily Fibonacci 38.2% | 0.6474 |
| Daily Fibonacci 61.8% | 0.6487 |
| Daily Pivot Point S1 | 0.6458 |
| Daily Pivot Point S2 | 0.6430 |
| Daily Pivot Point S3 | 0.6405 |
| Daily Pivot Point R1 | 0.6511 |
| Daily Pivot Point R2 | 0.6536 |
| Daily Pivot Point R3 | 0.6565 |
[/s2If]
Download Nehcap EAWe have two EAs that are operational on our LIVE accounts.
- EA-FIX: Check out the details here. Download EA-FIX . EA-FIX is a non-grid HFT scalper.
- EA-GROWTH: High quality low dd EA using trend grids. Download EA_GROWTHJoin Our Telegram Group
")


