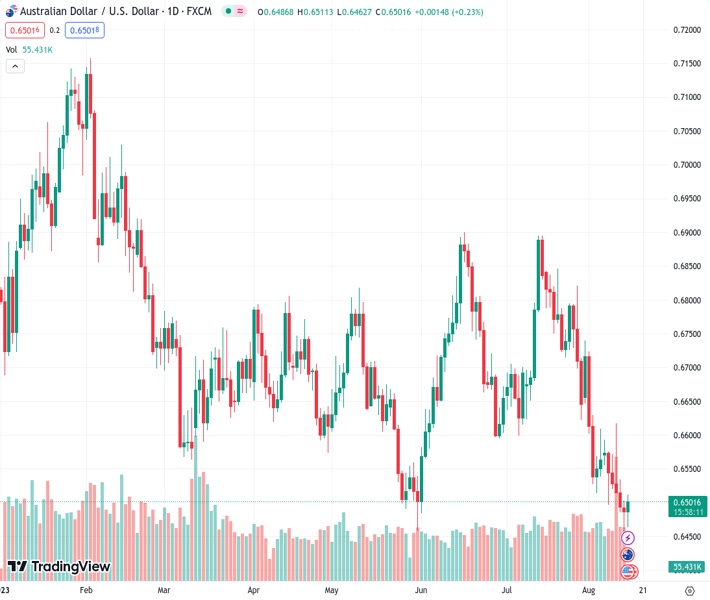
The AUD/USD pair, which stands at 0.65017, is experiencing increased buying interest, pushing it to reach its highest level of the day after a previous decline to its year-to-date low. In the opinion of @nehcap, only a modest rebound is anticipated and not a significant recovery.
…
This is a premium post.
[s2If !current_user_can(access_s2member_level4)]Please register for FREE REGISTER to read full post below containing analysis. In case of any error or you think you are not able to read the full post below, please email us at support#nehcap.com [lwa][/s2If] [s2If current_user_can(access_s2member_level1)]
- AUD/USD picks up bids to refresh intraday high, reverses from YTD low.
The pair currently trades last at 0.65017.
The previous day high was 0.6507 while the previous day low was 0.6454. The daily 38.2% Fib levels comes at 0.6474, expected to provide support. Similarly, the daily 61.8% fib level is at 0.6487, expected to provide support.
AUD/USD recaptures the 0.6500 round figure while extending the early Asian session rebound from the lowest level since November 2022 amid the Tuesday morning in Europe.
The Aussie pair dropped to the lowest levels in 2023 the previous day after broad risk aversion drowned the risk barometer.
However, the recently mixed headlines from the Reserve Bank of Australia’s (RBA) Minutes of its August monetary policy meeting and the top-tier data from Australia, as well as China, allowed the traders to print a corrective bounce from the 0.6460-55 support zone comprising lows marked in late May and the previous day.
Also read: AUD/USD remains below 0.6500 mark after softer Chinese macro data, seems vulnerable
Technically, the failure to provide a daily closing beneath 0.6458 joined the nearly oversold RSI conditions to trigger the AUD/USD pair’s latest rebound.
That said, the 10-DMA level of 0.6530 precedes the 61.8% Fibonacci retracement of October 2022 to February 2023 upside, near 0.6550, to restrict a short-term recovery of the Aussie pair.
Following that, a one-month-old descending resistance line and lows marked in June, as well as early July, respectively near 0.6570 and 0.6600, will be crucial to watch for the AUD/USD buyers to retake control.
On the flip side, a daily closing beneath the 0.6460-55 support area could quickly drag the quote to a September 2022 low of near 0.6365 ahead of highlighting the late 2022 bottom of around 0.6170 for the AUD/USD bears.
Trend: Limited recovery expected
Technical Levels: Supports and Resistances
AUDUSD currently trading at 0.6501 at the time of writing. Pair opened at 0.6487 and is trading with a change of 0.22% % .
| Overview | Overview.1 | |
|---|---|---|
| 0 | Today last price | 0.6501 |
| 1 | Today Daily Change | 0.0014 |
| 2 | Today Daily Change % | 0.22% |
| 3 | Today daily open | 0.6487 |
The pair remains strongly bearish on the daily time frame. It trades below the 20 SMA @ 0.6644, 50 SMA 0.6697, 100 SMA @ 0.668 and 200 SMA @ 0.6737.
| Trends | Trends.1 | |
|---|---|---|
| 0 | Daily SMA20 | 0.6644 |
| 1 | Daily SMA50 | 0.6697 |
| 2 | Daily SMA100 | 0.6680 |
| 3 | Daily SMA200 | 0.6737 |
The previous day high was 0.6507 while the previous day low was 0.6454. The daily 38.2% Fib levels comes at 0.6474, expected to provide support. Similarly, the daily 61.8% fib level is at 0.6487, expected to provide support.
Note the levels of interest below:
- Pivot support is noted at 0.6458, 0.643, 0.6405
- Pivot resistance is noted at 0.6511, 0.6536, 0.6565
| Levels | Levels.1 |
|---|---|
| Previous Daily High | 0.6507 |
| Previous Daily Low | 0.6454 |
| Previous Weekly High | 0.6617 |
| Previous Weekly Low | 0.6486 |
| Previous Monthly High | 0.6895 |
| Previous Monthly Low | 0.6599 |
| Daily Fibonacci 38.2% | 0.6474 |
| Daily Fibonacci 61.8% | 0.6487 |
| Daily Pivot Point S1 | 0.6458 |
| Daily Pivot Point S2 | 0.6430 |
| Daily Pivot Point S3 | 0.6405 |
| Daily Pivot Point R1 | 0.6511 |
| Daily Pivot Point R2 | 0.6536 |
| Daily Pivot Point R3 | 0.6565 |
[/s2If]
Download Nehcap EAWe have two EAs that are operational on our LIVE accounts.
- EA-FIX: Check out the details here. Download EA-FIX . EA-FIX is a non-grid HFT scalper.
- EA-GROWTH: High quality low dd EA using trend grids. Download EA_GROWTHJoin Our Telegram Group
")


