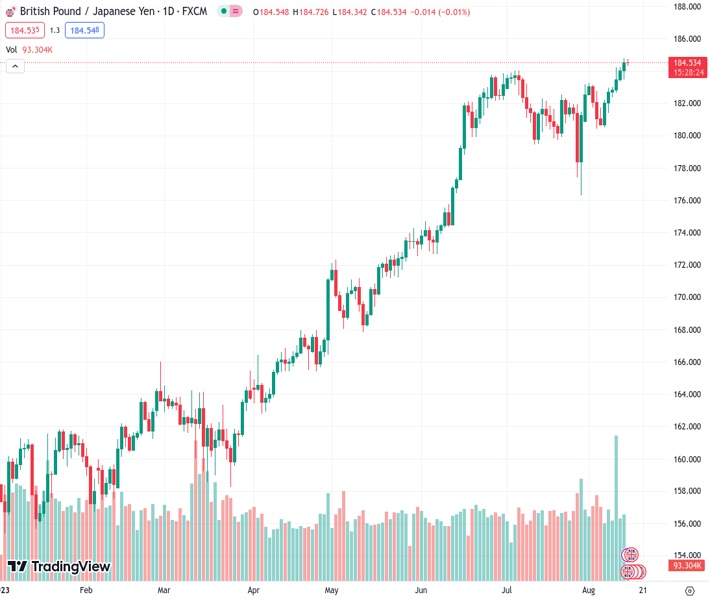
Since August 4, the currency pair GBPJPY has been trading within a trend-channel that is moving upwards. On Tuesday, it remains above the 154.50 area.
…
This is a premium post.
[s2If !current_user_can(access_s2member_level4)]Please register for FREE REGISTER to read full post below containing analysis. In case of any error or you think you are not able to read the full post below, please email us at support#nehcap.com [lwa][/s2If] [s2If current_user_can(access_s2member_level1)]
- GBP/JPY trades within an ascending trend-channel since August 4, holds above the 154.50 region on Tuesday.
The pair currently trades last at 184.560.
The previous day high was 184.78 while the previous day low was 183.46. The daily 38.2% Fib levels comes at 184.28, expected to provide support. Similarly, the daily 61.8% fib level is at 183.97, expected to provide support.
The GBP/JPY pair hovers around 184.50 after retreating from a YTD high of 184.78 heading into the early European session on Tuesday. Market participants await the UK employment data due later in the day. This event could trigger the volitility in the cross.
According to the one-hour chart, the GBP/JPY trades within an ascending trend-channel since August 4. The cross stands above the 50- and 100-hour Exponential Moving Averages (EMAs) with an upward slope, which means the further upside looks favourable for the cross.
GBP/JPY’s immediate resistance level is seen at 184.78 (YTD high). The key barrier emerges at a psychological round mark near 185.00. A decisive break above the latter could pave the way to 185.60 (the upper boundary of an ascending trend-channe). Any meaningful follow-through buying will see the next stop at 186.35 (weekly high of December 4, 2015) en route to 187.00 (a round figure and a weekly high of November 27, 2015).
Looking at the downside, the initial contention level to watch is at 184.35 (high of August 14). The key support zone is located at 184.00–184.10, representing a psuchological round figure, the 50-hour EMA, and the lower limit of the ascending trend-channel. Further south, the cross will see a drop to 183.65 (the 100-hour EMA) and finally 183.00 (high of August 8 and the round mark).
It’s worth noting that the Relative Strength Index (RSI) is located in bullish territory above 50, highlighting that further upside cannot be ruled out.
Technical Levels: Supports and Resistances
GBPJPY currently trading at 184.56 at the time of writing. Pair opened at 184.62 and is trading with a change of -0.03 % .
| Overview | Overview.1 | |
|---|---|---|
| 0 | Today last price | 184.56 |
| 1 | Today Daily Change | -0.06 |
| 2 | Today Daily Change % | -0.03 |
| 3 | Today daily open | 184.62 |
The pair remains strongly bullish on the daily timeframe. It trades above its 20 SMA @ 181.93, 50 SMA 181.08, 100 SMA @ 174.91 and 200 SMA @ 168.69.
| Trends | Trends.1 | |
|---|---|---|
| 0 | Daily SMA20 | 181.93 |
| 1 | Daily SMA50 | 181.08 |
| 2 | Daily SMA100 | 174.91 |
| 3 | Daily SMA200 | 168.69 |
The previous day high was 184.78 while the previous day low was 183.46. The daily 38.2% Fib levels comes at 184.28, expected to provide support. Similarly, the daily 61.8% fib level is at 183.97, expected to provide support.
Note the levels of interest below:
- Pivot support is noted at 183.8, 182.97, 182.48
- Pivot resistance is noted at 185.11, 185.6, 186.43
| Levels | Levels.1 |
|---|---|
| Previous Daily High | 184.78 |
| Previous Daily Low | 183.46 |
| Previous Weekly High | 184.25 |
| Previous Weekly Low | 180.58 |
| Previous Monthly High | 184.02 |
| Previous Monthly Low | 176.32 |
| Daily Fibonacci 38.2% | 184.28 |
| Daily Fibonacci 61.8% | 183.97 |
| Daily Pivot Point S1 | 183.80 |
| Daily Pivot Point S2 | 182.97 |
| Daily Pivot Point S3 | 182.48 |
| Daily Pivot Point R1 | 185.11 |
| Daily Pivot Point R2 | 185.60 |
| Daily Pivot Point R3 | 186.43 |
[/s2If]
Download Nehcap EAWe have two EAs that are operational on our LIVE accounts.
- EA-FIX: Check out the details here. Download EA-FIX . EA-FIX is a non-grid HFT scalper.
- EA-GROWTH: High quality low dd EA using trend grids. Download EA_GROWTHJoin Our Telegram Group
")


