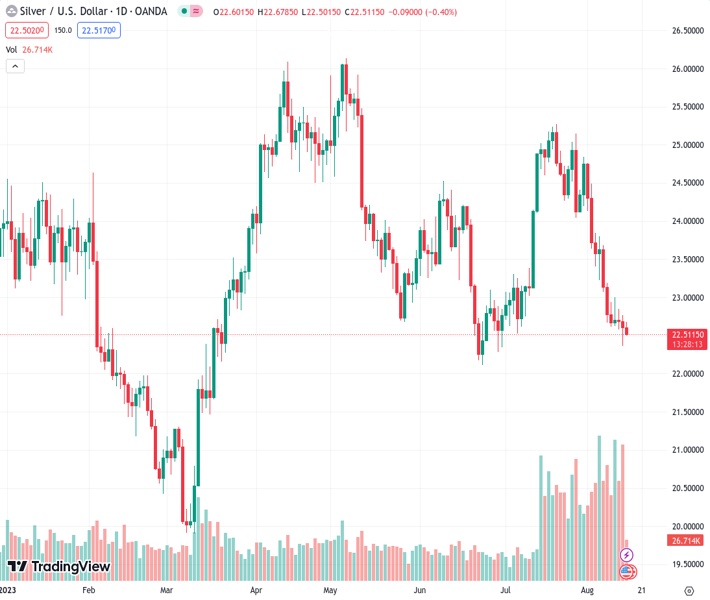
Silver is moving in a small range above its lowest point since June 30, which was established on Monday.
…
This is a premium post.
[s2If !current_user_can(access_s2member_level4)]Please register for FREE REGISTER to read full post below containing analysis. In case of any error or you think you are not able to read the full post below, please email us at support#nehcap.com [lwa][/s2If] [s2If current_user_can(access_s2member_level1)]
- Silver oscillates in a narrow band above its lowest level since June 30 set on Monday.
The pair currently trades last at 22.522.
The previous day high was 22.76 while the previous day low was 22.37. The daily 38.2% Fib levels comes at 22.52, expected to provide support. Similarly, the daily 61.8% fib level is at 22.61, expected to provide resistance.
Silver struggles to capitalize on the previous day’s modest bounce from the $22.35 region, or its lowest level since June 30 and oscillates in a narrow band through the early part of the European session on Tuesday. The white metal currently trades just above the mid-$22.00s and remains vulnerable to prolong the recent downward trajectory witnessed over the past four weeks or so.
Last week’s breakdown through a short-term ascending trend line support extending from the June swing low and a subsequent slide below the very important 200-day Simple Moving Average (SMA) was seen as a fresh trigger for bearish traders. Adding to this, technical indicators on the daily chart are holding deep in the negative territory and are still far from being in the oversold zone. This, along with the lack of any meaningful buying, suggests that the path of least resistance for the XAG/USD is to the downside.
Hence, some follow-through weakness back towards retesting the multi-month low, around the $22.15-$22.10 area touched in June, looks like a distinct possibility. This is closely followed by the $22.00 mark, below which the white metal could accelerate the fall towards the $21.55-$21.50 intermediate support en route to the $21.00 mark. The XAG/USD could extend the slide further towards the $21.00 round figure en route to the YTD low, or levels just below the $20.00 psychological mark touched in March.
On the flip side, attempted recovery is likely to confront some resistance near the overnight swing low, around the $22.75 region, ahead of the $23.00 round figure. Any subsequent move up might still be seen as a selling opportunity and remain capped near the $23.20-$23.30 confluence support breakpoint, now turned resistance. The latter should act as a pivotal point, which if cleared decisively might trigger a short-covering move and lift the XAG/USD to the $23.60-$23.65 horizontal barrier. Bulls might then aim to reclaim the $24.00 mark.
Technical Levels: Supports and Resistances
XAGUSD currently trading at 22.6 at the time of writing. Pair opened at 22.6 and is trading with a change of 0.0 % .
| Overview | Overview.1 | |
|---|---|---|
| 0 | Today last price | 22.6 |
| 1 | Today Daily Change | 0.0 |
| 2 | Today Daily Change % | 0.0 |
| 3 | Today daily open | 22.6 |
The pair remains strongly bearish on the daily time frame. It trades below the 20 SMA @ 23.93, 50 SMA 23.64, 100 SMA @ 24.05 and 200 SMA @ 23.26.
| Trends | Trends.1 | |
|---|---|---|
| 0 | Daily SMA20 | 23.93 |
| 1 | Daily SMA50 | 23.64 |
| 2 | Daily SMA100 | 24.05 |
| 3 | Daily SMA200 | 23.26 |
The previous day high was 22.76 while the previous day low was 22.37. The daily 38.2% Fib levels comes at 22.52, expected to provide support. Similarly, the daily 61.8% fib level is at 22.61, expected to provide resistance.
Note the levels of interest below:
- Pivot support is noted at 22.39, 22.18, 21.99
- Pivot resistance is noted at 22.79, 22.97, 23.18
| Levels | Levels.1 |
|---|---|
| Previous Daily High | 22.76 |
| Previous Daily Low | 22.37 |
| Previous Weekly High | 23.68 |
| Previous Weekly Low | 22.58 |
| Previous Monthly High | 25.27 |
| Previous Monthly Low | 22.52 |
| Daily Fibonacci 38.2% | 22.52 |
| Daily Fibonacci 61.8% | 22.61 |
| Daily Pivot Point S1 | 22.39 |
| Daily Pivot Point S2 | 22.18 |
| Daily Pivot Point S3 | 21.99 |
| Daily Pivot Point R1 | 22.79 |
| Daily Pivot Point R2 | 22.97 |
| Daily Pivot Point R3 | 23.18 |
[/s2If]
Download Nehcap EAWe have two EAs that are operational on our LIVE accounts.
- EA-FIX: Check out the details here. Download EA-FIX . EA-FIX is a non-grid HFT scalper.
- EA-GROWTH: High quality low dd EA using trend grids. Download EA_GROWTHJoin Our Telegram Group
")


