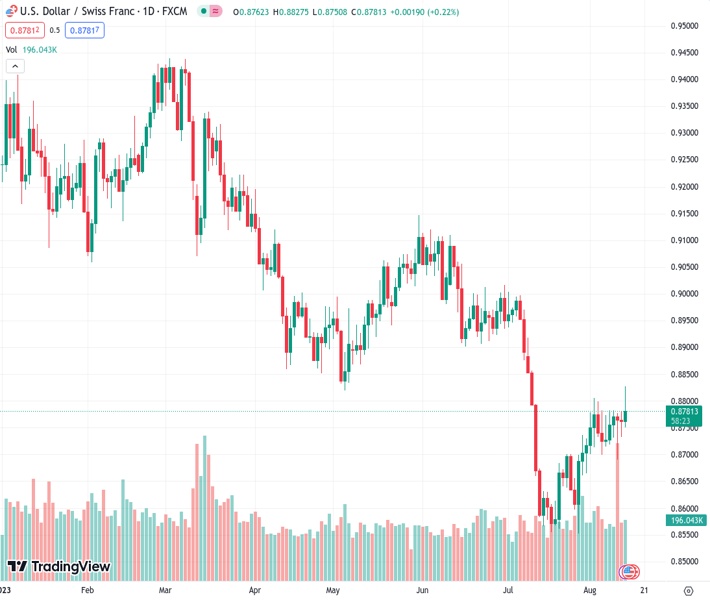
The USDCHF pair has risen by 0.20% to reach 0.8780, although it continues to face resistance near the 0.8800 level.
…
This is a premium post.
[s2If !current_user_can(access_s2member_level4)]Please register for FREE REGISTER to read full post below containing analysis. In case of any error or you think you are not able to read the full post below, please email us at support#nehcap.com [lwa][/s2If] [s2If current_user_can(access_s2member_level1)]
- USD/CHF climbs by 0.20%, trading at 0.8780, but remains under the shadow of the 0.8800 resistance.
The pair currently trades last at 0.87835.
The previous day high was 0.8781 while the previous day low was 0.8735. The daily 38.2% Fib levels comes at 0.8753, expected to provide support. Similarly, the daily 61.8% fib level is at 0.8763, expected to provide support.
The USD/CHF climbed modestly on Monday’s session though it failed to cling above the 0.8800 figure, which could weigh on the pair in the near term. Additionally, the USD/CHF failing to break a downslope resistance trendline drawn from November 2022 highs opened the door for further losses. The USD/CHF is trading at 0.8780, gains 0.20% but remains subject to selling pressure.
From a technical standpoint, the USD/CHF registered a ‘double-top’ chart pattern, which could pave the way for further downside, but mixed signals from an oscillator perspective could refrain sellers from lowering prices.
The Relative Strength Index (RSI) indicates that buyers are gathering momentum, while the three-day Rate of Change (RoC) depicts the USD/CHF as neutral.
If USD/CHF buyers reclaim 0.8800, they must reclaim the 50-day Exponential Moving Average (EMA) at 0.8811. A breach of the latter would expose the 100-day EMA at 0.8921.
Conversely, if USD/CHF sellers remain in control, the next support would be the 20-day EMA at 0.8746. Break below will expose the August 10 low of 0.8689, followed by the year-to-date (YTD) low of 0.8551.
Technical Levels: Supports and Resistances
USDCHF currently trading at 0.878 at the time of writing. Pair opened at 0.8765 and is trading with a change of 0.17 % .
| Overview | Overview.1 | |
|---|---|---|
| 0 | Today last price | 0.8780 |
| 1 | Today Daily Change | 0.0015 |
| 2 | Today Daily Change % | 0.1700 |
| 3 | Today daily open | 0.8765 |
The pair is trading above its 20 Daily moving average @ 0.8697, below its 50 Daily moving average @ 0.8842 , below its 100 Daily moving average @ 0.8921 and below its 200 Daily moving average @ 0.9124
| Trends | Trends.1 | |
|---|---|---|
| 0 | Daily SMA20 | 0.8697 |
| 1 | Daily SMA50 | 0.8842 |
| 2 | Daily SMA100 | 0.8921 |
| 3 | Daily SMA200 | 0.9124 |
The previous day high was 0.8781 while the previous day low was 0.8735. The daily 38.2% Fib levels comes at 0.8753, expected to provide support. Similarly, the daily 61.8% fib level is at 0.8763, expected to provide support.
Note the levels of interest below:
- Pivot support is noted at 0.874, 0.8715, 0.8695
- Pivot resistance is noted at 0.8786, 0.8806, 0.8831
| Levels | Levels.1 |
|---|---|
| Previous Daily High | 0.8781 |
| Previous Daily Low | 0.8735 |
| Previous Weekly High | 0.8783 |
| Previous Weekly Low | 0.8690 |
| Previous Monthly High | 0.9005 |
| Previous Monthly Low | 0.8552 |
| Daily Fibonacci 38.2% | 0.8753 |
| Daily Fibonacci 61.8% | 0.8763 |
| Daily Pivot Point S1 | 0.8740 |
| Daily Pivot Point S2 | 0.8715 |
| Daily Pivot Point S3 | 0.8695 |
| Daily Pivot Point R1 | 0.8786 |
| Daily Pivot Point R2 | 0.8806 |
| Daily Pivot Point R3 | 0.8831 |
[/s2If]
Download Nehcap EAWe have two EAs that are operational on our LIVE accounts.
- EA-FIX: Check out the details here. Download EA-FIX . EA-FIX is a non-grid HFT scalper.
- EA-GROWTH: High quality low dd EA using trend grids. Download EA_GROWTHJoin Our Telegram Group
")


