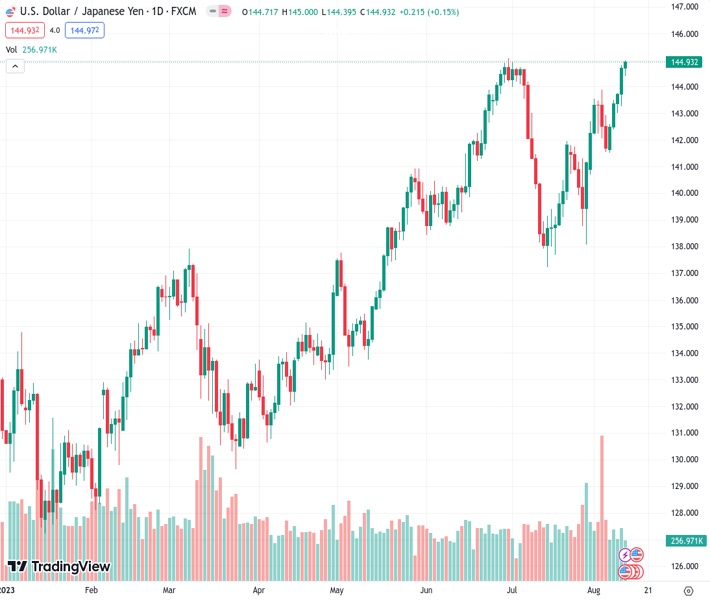
The USDJPY is currently trading in positive territory for the fifth straight day, hovering near the important 145.00 level.
…
This is a premium post.
[s2If !current_user_can(access_s2member_level4)]Please register for FREE REGISTER to read full post below containing analysis. In case of any error or you think you are not able to read the full post below, please email us at support#nehcap.com [lwa][/s2If] [s2If current_user_can(access_s2member_level1)]
- The pair trades green for a fifth consecutive day, around the critical 145.00 zone.
The pair currently trades last at 144.950.
The previous day high was 144.82 while the previous day low was 143.29. The daily 38.2% Fib levels comes at 144.23, expected to provide support. Similarly, the daily 61.8% fib level is at 143.87, expected to provide support.
On the last day of the week, the USD/JPY rose near the 145.00 zone, showing more than 2% of weekly gains. This movement was driven by a vital Producer Price Index (PPI) from the US for July and optimistic personal consumer confidence data released by the University of Michigan (UoM). The US treasury bond yields are increasing and show more than 1% of daily gains from this. On the Japanese side, Yen continues to trade weak as investors continue to place bets on a dovish stance by the Bank of Japan (BoJ).
PPI data on Friday saw the headline figure jumping to 2.4% YoY in July, slightly higher than expected. This comes with the US releasing this week that the headline and core Consumer Price Index (CPI) decelerated in the same month, so overall, the US inflation outlook is mixed.
That being said, the US bond yields are seeing gains across the curve driven by hawkish bets on the Federal Reserve. The 10-year bond yield rose to 4.18%, while the 2-year yield stands at 4.90% and the 5-year yielding 4.31%, respectively. In line with that, the CME FedWatch tool indicates that the odds of a 25 basis point (bps) hike in the November meeting rose to nearly 30% but remain low for the upcoming September decision.
On the JPY’s side, no relevant data was released, and the focus shifted to next week’s Gross Domestic Product (GDP) data from Q2 from Japan.
Considering the daily chart, the USD/JPY shows a bullish outlook for the short term. The Relative Strength Index (RSI), positioned above its midline in positive territory with a northward slope, supports this view along with the positive indication from the Moving Average Convergence Divergence (MACD), which is displaying green bars, pointing towards a strengthening bullish trend. On the other hand, the pair is above the 20,100,200-day Simple Moving Averages (SMAs), indicating that the bulls are in command of the broader picture.
Support levels: 143.70, 143.00, 142.00.
Resistance levels: 145.00, 145.50, 146.00.
Technical Levels: Supports and Resistances
USDJPY currently trading at 144.95 at the time of writing. Pair opened at 144.75 and is trading with a change of 0.14 % .
| Overview | Overview.1 | |
|---|---|---|
| 0 | Today last price | 144.95 |
| 1 | Today Daily Change | 0.20 |
| 2 | Today Daily Change % | 0.14 |
| 3 | Today daily open | 144.75 |
The pair remains strongly bullish on the daily timeframe. It trades above its 20 SMA @ 141.44, 50 SMA 141.6, 100 SMA @ 138.37 and 200 SMA @ 136.49.
| Trends | Trends.1 | |
|---|---|---|
| 0 | Daily SMA20 | 141.44 |
| 1 | Daily SMA50 | 141.60 |
| 2 | Daily SMA100 | 138.37 |
| 3 | Daily SMA200 | 136.49 |
The previous day high was 144.82 while the previous day low was 143.29. The daily 38.2% Fib levels comes at 144.23, expected to provide support. Similarly, the daily 61.8% fib level is at 143.87, expected to provide support.
Note the levels of interest below:
- Pivot support is noted at 143.75, 142.75, 142.22
- Pivot resistance is noted at 145.28, 145.81, 146.81
| Levels | Levels.1 |
|---|---|
| Previous Daily High | 144.82 |
| Previous Daily Low | 143.29 |
| Previous Weekly High | 143.89 |
| Previous Weekly Low | 140.69 |
| Previous Monthly High | 144.91 |
| Previous Monthly Low | 137.24 |
| Daily Fibonacci 38.2% | 144.23 |
| Daily Fibonacci 61.8% | 143.87 |
| Daily Pivot Point S1 | 143.75 |
| Daily Pivot Point S2 | 142.75 |
| Daily Pivot Point S3 | 142.22 |
| Daily Pivot Point R1 | 145.28 |
| Daily Pivot Point R2 | 145.81 |
| Daily Pivot Point R3 | 146.81 |
[/s2If]
Download Nehcap EAWe have two EAs that are operational on our LIVE accounts.
- EA-FIX: Check out the details here. Download EA-FIX . EA-FIX is a non-grid HFT scalper.
- EA-GROWTH: High quality low dd EA using trend grids. Download EA_GROWTHJoin Our Telegram Group
")


