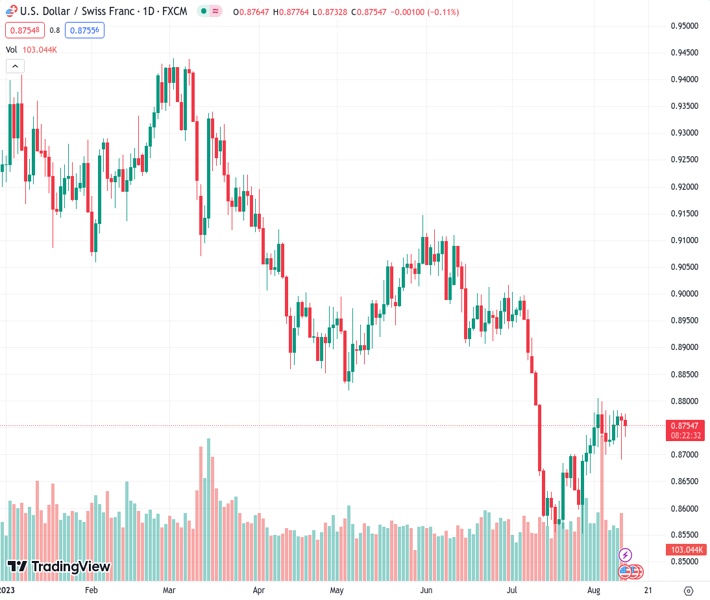
The USDCHF currency pair, currently at 0.87580, is moving back and forth within a broad range and is unable to make a clear direction after the release of US inflation data.
…
This is a premium post.
[s2If !current_user_can(access_s2member_level4)]Please register for FREE REGISTER to read full post below containing analysis. In case of any error or you think you are not able to read the full post below, please email us at support#nehcap.com [lwa][/s2If] [s2If current_user_can(access_s2member_level1)]
- USD/CHF oscillates in a wide range and fails to find a decisive move despite the US inflation data release.
The pair currently trades last at 0.87580.
The previous day high was 0.8777 while the previous day low was 0.869. The daily 38.2% Fib levels comes at 0.8723, expected to provide support. Similarly, the daily 61.8% fib level is at 0.8744, expected to provide support.
The USD/CHF pair stays in a sideways profile below the round-level resistance of 0.8800 in the European session. The Swiss Franc asset struggles to find direction despite lower-than-expected growth in the United States Consumer Price Index (CPI) data for July.
Monthly inflation grew at a 0.2% pace, in alignment with Federal Reserve’s (Fed) desired rate of 2%. The US Dollar Index (DXY) is aiming to resume its upside journey after a sideways performance ahead of US Producer Price Index (PPI) data.
The market mood turns cautious as US President Joe Biden authorized to ban some investments in China in some sensitive technologies in three sectors: semiconductors and microelectronics, quantum information technologies, and certain artificial intelligence systems.
USD/CHF traded directionless from the past week despite slower growth in the US inflation. The major turned sideways after a firmer rally after climbing above the horizontal resistance plotted from July 24 high at 0.8700, which turned into support now. The asset oscillates in a range of 0.8700-0.8783, which indicates volatility contraction.
The pair makes efforts to maintain an auction above the 20-period Exponential Moving Average (EMA) at 0.8760.
Momentum oscillator Relative Strength Index (RSI) (14) trades inside the 40.00-60.00, indicating a volatility squeeze.
Going forward, a decisive break above August 2 high at 0.8806 will drive the asset towards April 26 low at 0.8852, followed by June 16 low around 0.8900.
In an alternate scenario, a downside move below August 10 low at 0.8690 would drag the asset toward July 17 high at 0.8630 and July 27 low at 0.8552.
Technical Levels: Supports and Resistances
USDCHF currently trading at 0.8766 at the time of writing. Pair opened at 0.8767 and is trading with a change of -0.01 % .
| Overview | Overview.1 | |
|---|---|---|
| 0 | Today last price | 0.8766 |
| 1 | Today Daily Change | -0.0001 |
| 2 | Today Daily Change % | -0.0100 |
| 3 | Today daily open | 0.8767 |
The pair is trading above its 20 Daily moving average @ 0.8689, below its 50 Daily moving average @ 0.8849 , below its 100 Daily moving average @ 0.8926 and below its 200 Daily moving average @ 0.9129
| Trends | Trends.1 | |
|---|---|---|
| 0 | Daily SMA20 | 0.8689 |
| 1 | Daily SMA50 | 0.8849 |
| 2 | Daily SMA100 | 0.8926 |
| 3 | Daily SMA200 | 0.9129 |
The previous day high was 0.8777 while the previous day low was 0.869. The daily 38.2% Fib levels comes at 0.8723, expected to provide support. Similarly, the daily 61.8% fib level is at 0.8744, expected to provide support.
Note the levels of interest below:
- Pivot support is noted at 0.8713, 0.8658, 0.8626
- Pivot resistance is noted at 0.8799, 0.8832, 0.8886
| Levels | Levels.1 |
|---|---|
| Previous Daily High | 0.8777 |
| Previous Daily Low | 0.8690 |
| Previous Weekly High | 0.8806 |
| Previous Weekly Low | 0.8665 |
| Previous Monthly High | 0.9005 |
| Previous Monthly Low | 0.8552 |
| Daily Fibonacci 38.2% | 0.8723 |
| Daily Fibonacci 61.8% | 0.8744 |
| Daily Pivot Point S1 | 0.8713 |
| Daily Pivot Point S2 | 0.8658 |
| Daily Pivot Point S3 | 0.8626 |
| Daily Pivot Point R1 | 0.8799 |
| Daily Pivot Point R2 | 0.8832 |
| Daily Pivot Point R3 | 0.8886 |
[/s2If]
Download Nehcap EAWe have two EAs that are operational on our LIVE accounts.
- EA-FIX: Check out the details here. Download EA-FIX . EA-FIX is a non-grid HFT scalper.
- EA-GROWTH: High quality low dd EA using trend grids. Download EA_GROWTHJoin Our Telegram Group
")


