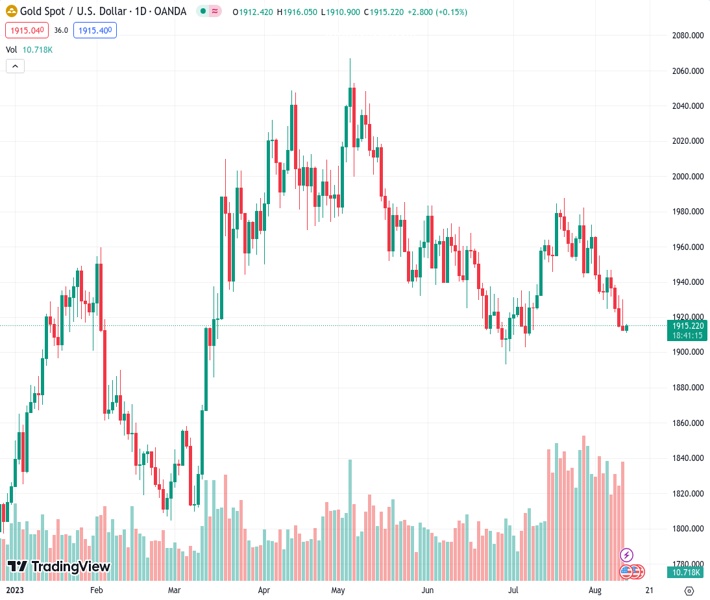
The price of gold, represented by #XAUUSD, experiences an increase and receives some support due to a slight decline in the value of the US Dollar.
…
This is a premium post.
[s2If !current_user_can(access_s2member_level4)]Please register for FREE REGISTER to read full post below containing analysis. In case of any error or you think you are not able to read the full post below, please email us at support#nehcap.com [lwa][/s2If] [s2If current_user_can(access_s2member_level1)]
- Gold price gains some positive traction and draws support from a modest US Dollar weakness.
The pair currently trades last at 1914.98.
The previous day high was 1930.23 while the previous day low was 1912.14. The daily 38.2% Fib levels comes at 1919.05, expected to provide resistance. Similarly, the daily 61.8% fib level is at 1923.32, expected to provide resistance.
Gold price stages a modest recovery from its lowest level since July 7, around the $1,911-$1,910 area set during the Asian session this Friday and for now, seems to have snapped a four-day losing streak. The XAU/USD currently trades around the $1,915-$1,916 region, up over 0.10% for the day, though lacks bullish conviction and remains vulnerable.
The US Dollar (USD) struggles to capitalize on the overnight solid rebound from over a one-week low touched in reaction to the softer consumer inflation figures from the United States (USD) and pulls back from the vicinity of the monthly peak. A softer Greenback is seen as a key factor driving flows towards the US Dollar-denominated Gold price. The USD downtick, meanwhile, lacks any fundamental catalyst and is more likely to remain limited in the wake of growing acceptance that the Federal Reserve (Fed) will stick to its hawkish stance.
The US Bureau of Labor Statistics (BLS) reported on Thursday that the headline US Consumer Price Index (CPI) rose less than expected, from 3% to 3.2% YoY rate in July. Adding to this, the Core CPI inflation, which excludes volatile food and energy prices, edged lower to 4.7% from 4.8% in June and indicated that some measures of underlying price pressures cooled significantly last month. The inflation, however, is way above the Fed’s 2% target and keeps the door for one-more 25 basis points (bps) rate hike by the end of this year wide open.
The prospects for further policy tightening by the Fed continue to push the US Treasury bond yields high, which should help limit the downside for the USD and cap gains for the non-yielding Gold price. Apart from this, a positive tone around the US equity futures might further contribute to keeping a lid on the safe-haven precious metal. This makes it prudent to wait for strong follow-through buying before confirming that the XAU/USD has formed a near-term bottom and that the recent downtrend witnessed over the past three weeks or so has run its course.
Market participants now look to the US economic docket, featuring the release of the Producer Price Index (PPI), along with the Preliminary Michigan Consumer Sentiment and Inflation Expectations. This, along with the US bond yields, might influence the USD price dynamics and provide some impetus to the Gold price. Apart from this, the broader risk sentiment should allow traders to grab short-term opportunities. Nevertheless, the XAU/USD remains on end in the red for the third successive week and post its lowest weekly closing since March.
XAU/USD
Technical Levels: Supports and Resistances
XAUUSD currently trading at 1915.54 at the time of writing. Pair opened at 1912.27 and is trading with a change of 0.17 % .
| Overview | Overview.1 | |
|---|---|---|
| 0 | Today last price | 1915.54 |
| 1 | Today Daily Change | 3.27 |
| 2 | Today Daily Change % | 0.17 |
| 3 | Today daily open | 1912.27 |
The pair is trading below its 20 Daily moving average @ 1950.19, below its 50 Daily moving average @ 1942.07 , below its 100 Daily moving average @ 1967.18 and above its 200 Daily moving average @ 1900.53
| Trends | Trends.1 | |
|---|---|---|
| 0 | Daily SMA20 | 1950.19 |
| 1 | Daily SMA50 | 1942.07 |
| 2 | Daily SMA100 | 1967.18 |
| 3 | Daily SMA200 | 1900.53 |
The previous day high was 1930.23 while the previous day low was 1912.14. The daily 38.2% Fib levels comes at 1919.05, expected to provide resistance. Similarly, the daily 61.8% fib level is at 1923.32, expected to provide resistance.
Note the levels of interest below:
- Pivot support is noted at 1906.2, 1900.12, 1888.11
- Pivot resistance is noted at 1924.29, 1936.3, 1942.38
| Levels | Levels.1 |
|---|---|
| Previous Daily High | 1930.23 |
| Previous Daily Low | 1912.14 |
| Previous Weekly High | 1972.45 |
| Previous Weekly Low | 1925.72 |
| Previous Monthly High | 1987.54 |
| Previous Monthly Low | 1902.77 |
| Daily Fibonacci 38.2% | 1919.05 |
| Daily Fibonacci 61.8% | 1923.32 |
| Daily Pivot Point S1 | 1906.20 |
| Daily Pivot Point S2 | 1900.12 |
| Daily Pivot Point S3 | 1888.11 |
| Daily Pivot Point R1 | 1924.29 |
| Daily Pivot Point R2 | 1936.30 |
| Daily Pivot Point R3 | 1942.38 |
[/s2If]
Download Nehcap EAWe have two EAs that are operational on our LIVE accounts.
- EA-FIX: Check out the details here. Download EA-FIX . EA-FIX is a non-grid HFT scalper.
- EA-GROWTH: High quality low dd EA using trend grids. Download EA_GROWTHJoin Our Telegram Group
")


