The Mexican Peso (MXN) is gaining ground against the US Dollar, even though the US Dollar is generally strong.
…
This is a premium post.
[s2If !current_user_can(access_s2member_level4)]Please register for FREE REGISTER to read full post below containing analysis. In case of any error or you think you are not able to read the full post below, please email us at support#nehcap.com [lwa][/s2If] [s2If current_user_can(access_s2member_level1)]
- The Mexican Peso (MXN) advances against the US Dollar, despite overall US Dollar strength.
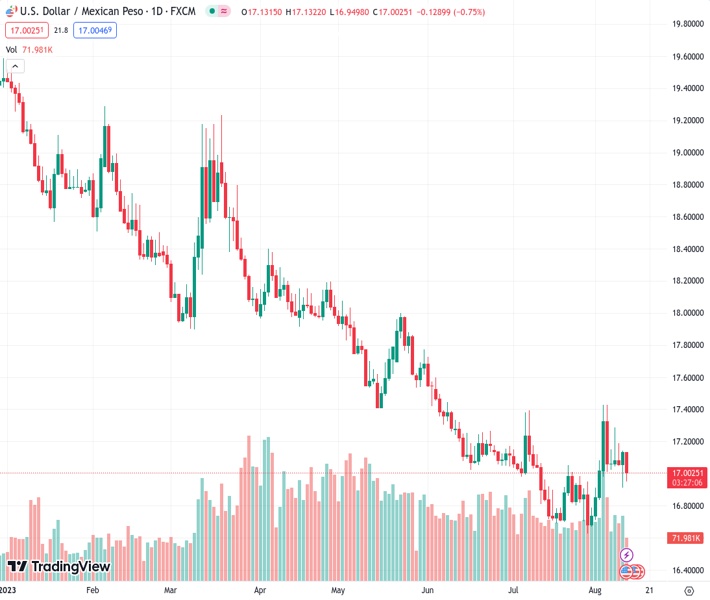
The pair currently trades last at 16.9993.
The previous day high was 17.1426 while the previous day low was 16.9101. The daily 38.2% Fib levels comes at 17.0538, expected to provide resistance. Similarly, the daily 61.8% fib level is at 16.9989, expected to provide support.
The Mexican Peso (MXN) appreciates against the US Dollar (USD), bucking the trend of Latin American currencies weakening on Friday after the Bank of Mexico (Banxico) kept rates unchanged, even though an uptick in US factory inflation boosted the USD. Nevertheless, the USD/MXN extends its losses and trades above the 17.0000 figure for seven straight days.
A risk-off impulse keeps the Greenback in the driver’s seat except for the MXN, with the emerging market currency posting solid gains of 0.87% as the USD/MXN extends its losses past 17.0000. On Thursday, Banxico decided unanimously to hold rates at 11.25%, as the central bank underscored the inflationary outlook as remaining “very complex” and suggested a similar approach as the Federal Reserve, keeping rates higher for longer. Although inflation is converging towards Banxico’s 3% plus or minus 1% range, with July CPI at 4.79%, the central bank continues to display a hawkish message. Meanwhile, analysts estimate Banxico’s first rate cut towards the end of the year.
That favored USD/MXN downside, accelerated by soft US consumer inflation data. USD/MXN gained some traction above 17.0000 after the US Department of Labor reported on the Producer Price Index (PPI) for July came at 0.3% MoM above forecasts of 0.2%, while annual numbers increased from 0.2% to 0.8%. Core PPI readings which exclude volatile items to gather a better reading of inflation, climbed 0.3% MoM, exceeding estimates and the prior’s month -0.1% slide, while annually based, exceeded estimates but was unchanged, compared to June’s 2.4%.
The University of Michigan Consumer Sentiment poll, revealed that US consumer sentiment slightly deteriorated. Still, Americans remain optimistic that inflation would get lowered after the US Federal Reserve (Fed) increased 525 bps its borrowing costs, with inflation expected to dive below 3% on a five-year horizon.
In the meantime, the US Dollar Index (DXY), which measures the buck’s performance against a basket of six currencies, rises 0.20%, at 102.866, underpinned by US Treasury bond yields climbing, with the US 10-year benchmark note sitting at 4.160%, gains five basis point.
Given the backdrop, the USD/MXN would remain subdued, at around current exchange rates, unless the pair breaks above 17.4100, which could see the pair finding acceptance at around 17.5000. Otherwise, further downside is expected, if USD/MXN prints a daily close below 17.0000.
From a technical standpoint, the USD/MXN is trading within the 17.00-17.30 range, with neither buyers nor sellers taking control of the USD/MXN pair direction. The USD/MXN spot price remains above the 20-day Exponential Moving Average (EMA) at 16.9946, which could pave the way for further upside, but buyers must lift the exchange rate above the May 17 swing low of 17.4039 to challenge the 100-day EMA at 17.4746, and the 17.5000 mark. Conversely, a daily close below 17.00 could expose the USD/MXN to further selling pressure, with sellers eyeing 16.6238, the YTD low.
Technical Levels: Supports and Resistances
USDMXN currently trading at 17.0058 at the time of writing. Pair opened at 17.1362 and is trading with a change of -0.76 % .
| Overview | Overview.1 | |
|---|---|---|
| 0 | Today last price | 17.0058 |
| 1 | Today Daily Change | -0.1304 |
| 2 | Today Daily Change % | -0.7600 |
| 3 | Today daily open | 17.1362 |
The pair is trading above its 20 Daily moving average @ 16.922, below its 50 Daily moving average @ 17.0671 , below its 100 Daily moving average @ 17.4979 and below its 200 Daily moving average @ 18.2627
| Trends | Trends.1 | |
|---|---|---|
| 0 | Daily SMA20 | 16.9220 |
| 1 | Daily SMA50 | 17.0671 |
| 2 | Daily SMA100 | 17.4979 |
| 3 | Daily SMA200 | 18.2627 |
The previous day high was 17.1426 while the previous day low was 16.9101. The daily 38.2% Fib levels comes at 17.0538, expected to provide resistance. Similarly, the daily 61.8% fib level is at 16.9989, expected to provide support.
Note the levels of interest below:
- Pivot support is noted at 16.9834, 16.8305, 16.7509
- Pivot resistance is noted at 17.2158, 17.2954, 17.4482
| Levels | Levels.1 |
|---|---|
| Previous Daily High | 17.1426 |
| Previous Daily Low | 16.9101 |
| Previous Weekly High | 17.4274 |
| Previous Weekly Low | 16.6694 |
| Previous Monthly High | 17.3957 |
| Previous Monthly Low | 16.6258 |
| Daily Fibonacci 38.2% | 17.0538 |
| Daily Fibonacci 61.8% | 16.9989 |
| Daily Pivot Point S1 | 16.9834 |
| Daily Pivot Point S2 | 16.8305 |
| Daily Pivot Point S3 | 16.7509 |
| Daily Pivot Point R1 | 17.2158 |
| Daily Pivot Point R2 | 17.2954 |
| Daily Pivot Point R3 | 17.4482 |
[/s2If]
Download Nehcap EAWe have two EAs that are operational on our LIVE accounts.
- EA-FIX: Check out the details here. Download EA-FIX . EA-FIX is a non-grid HFT scalper.
- EA-GROWTH: High quality low dd EA using trend grids. Download EA_GROWTHJoin Our Telegram Group
")


