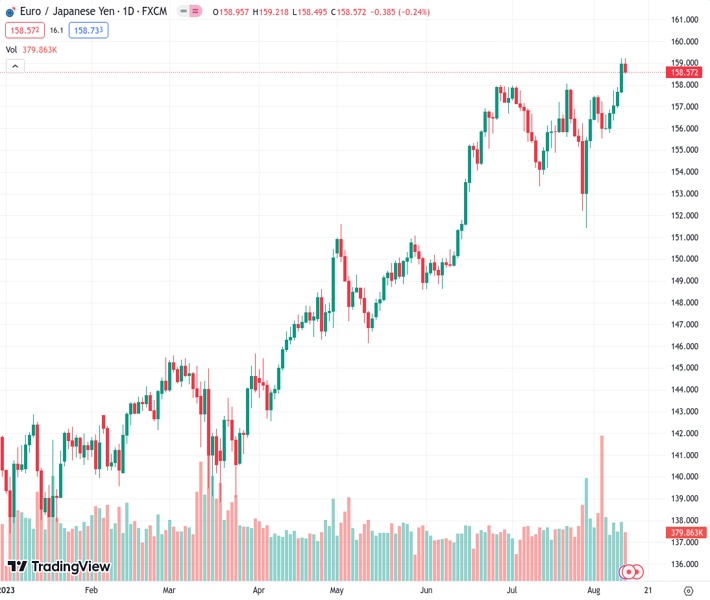
The EURJPY pair, currently at 158.598, experienced a decline below the 159.00 level after a string of five days with increasing values.
…
This is a premium post.
[s2If !current_user_can(access_s2member_level4)]Please register for FREE REGISTER to read full post below containing analysis. In case of any error or you think you are not able to read the full post below, please email us at support#nehcap.com [lwa][/s2If] [s2If current_user_can(access_s2member_level1)]
- The EUR/JPY traded in the red below the 159.00 area after five consecutive days of gains.
The pair currently trades last at 158.598.
The previous day high was 159.21 while the previous day low was 157.66. The daily 38.2% Fib levels comes at 158.62, expected to provide resistance. Similarly, the daily 61.8% fib level is at 158.25, expected to provide support.
In Friday’s session, the EUR/JPY traded with losses, closed negative below the 159.00 area, and corrected after five consecutive days of gains. On the Euro’s side, France’s Consumer Price Index (CPI) figures slightly surprised to the upside but failed to significantly impact the pair, while no relevant reports featured on the Japanese economic calendar. All eyes are now on the Gross Domestic Product (GDP) for Q2, which will be released next week, for both the Eurozone and Japan region will help investors to place their bets on the European Central Bank (ECB) and Bank of Japan (BoJ) following decisions.
The daily chart analysis indicates a bullish outlook for the EUR/JPY in the short term despite Friday’s losses. The Relative Strength Index (RSI) is above its midline in positive territory aligning with the positive signal from the Moving Average Convergence Divergence (MACD), which displays green bars, reinforcing the strong bullish sentiment. Additionally, the pair is comfortably above the 20,100,200-day Simple Moving Averages (SMAs), indicating that the bulls are clearly in command on the broader picture.
Support levels: 157.60, 157.00, 156.00.
Resistance levels: 159.00, 159.50, 160.00.
Technical Levels: Supports and Resistances
EURJPY currently trading at 158.72 at the time of writing. Pair opened at 158.98 and is trading with a change of -0.16 % .
| Overview | Overview.1 | |
|---|---|---|
| 0 | Today last price | 158.72 |
| 1 | Today Daily Change | -0.26 |
| 2 | Today Daily Change % | -0.16 |
| 3 | Today daily open | 158.98 |
The pair remains strongly bullish on the daily timeframe. It trades above its 20 SMA @ 156.38, 50 SMA 155.15, 100 SMA @ 151.2 and 200 SMA @ 146.95.
| Trends | Trends.1 | |
|---|---|---|
| 0 | Daily SMA20 | 156.38 |
| 1 | Daily SMA50 | 155.15 |
| 2 | Daily SMA100 | 151.20 |
| 3 | Daily SMA200 | 146.95 |
The previous day high was 159.21 while the previous day low was 157.66. The daily 38.2% Fib levels comes at 158.62, expected to provide resistance. Similarly, the daily 61.8% fib level is at 158.25, expected to provide support.
Note the levels of interest below:
- Pivot support is noted at 158.02, 157.06, 156.47
- Pivot resistance is noted at 159.57, 160.17, 161.13
| Levels | Levels.1 |
|---|---|
| Previous Daily High | 159.21 |
| Previous Daily Low | 157.66 |
| Previous Weekly High | 157.50 |
| Previous Weekly Low | 155.11 |
| Previous Monthly High | 158.05 |
| Previous Monthly Low | 151.41 |
| Daily Fibonacci 38.2% | 158.62 |
| Daily Fibonacci 61.8% | 158.25 |
| Daily Pivot Point S1 | 158.02 |
| Daily Pivot Point S2 | 157.06 |
| Daily Pivot Point S3 | 156.47 |
| Daily Pivot Point R1 | 159.57 |
| Daily Pivot Point R2 | 160.17 |
| Daily Pivot Point R3 | 161.13 |
[/s2If]
Download Nehcap EAWe have two EAs that are operational on our LIVE accounts.
- EA-FIX: Check out the details here. Download EA-FIX . EA-FIX is a non-grid HFT scalper.
- EA-GROWTH: High quality low dd EA using trend grids. Download EA_GROWTHJoin Our Telegram Group
")


