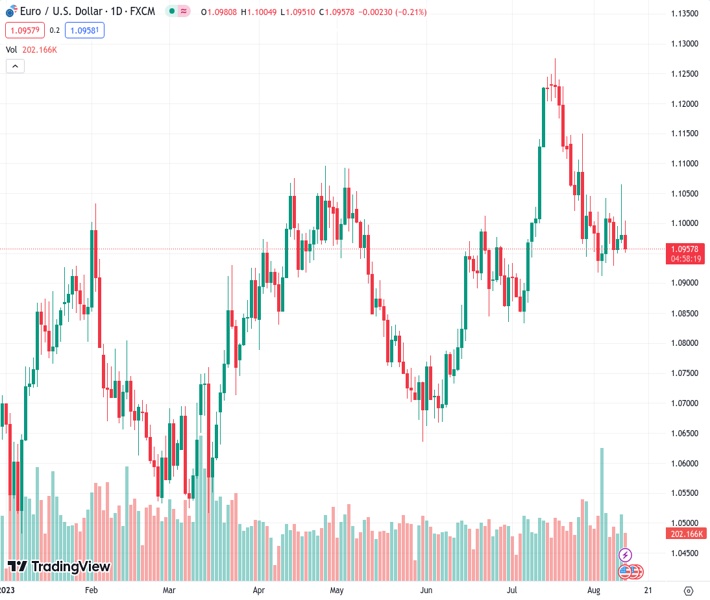
During Friday’s North American trading session, the EURUSD pair saw a decline, dropping from a daily high of 1.1000 to 1.0975.
…
This is a premium post.
[s2If !current_user_can(access_s2member_level4)]Please register for FREE REGISTER to read full post below containing analysis. In case of any error or you think you are not able to read the full post below, please email us at support#nehcap.com [lwa][/s2If] [s2If current_user_can(access_s2member_level1)]
- EUR/USD experienced losses during Friday’s North American session, reaching 1.0975 from a daily high of 1.1000.
The pair currently trades last at 1.09560.
The previous day high was 1.1065 while the previous day low was 1.0967. The daily 38.2% Fib levels comes at 1.1028, expected to provide resistance. Similarly, the daily 61.8% fib level is at 1.1005, expected to provide resistance.
EUR/USD registered losses during Friday’s North American session after reaching a daily high of 1.1000, but an uptick in wholesale inflation in the United States (US) increased appetite for the safe-haven status of the Greenback. Hence, the EUR/USD reversed its course and trades at 1.0958, down 0.20%.
Risk-aversion keeps flows toward the US Dollar (USD) even though consumer inflation in July cooled down, as the US Department of Labor reported on Thursday. Nevertheless, an early report but the same institution witnessed a jump in the Producer Price Index (PPI) of 0.3% MoM above estimates of 0.2%, while annually based ticked up from 0.2% to 0.8%. Core PPI readings which exclude volatile items to gather a better reading about inflation, rose by 0.3% MoM, exceeding estimates and the prior’s month -0.1% slide, while annually based, exceeded estimates but was unchanged, compared to June’s 2.4%.
Following the data, the EUR/USD plunged from around 1.1000 toward the 1.0960 region, extending its drop toward the daily lows of 1.0954 before finding bids and recovering some ground.
The University of Michigan recently revealed that consumer sentiment has deteriorated compared to July 71.6, coming at 71.2, while inflation expectations improved. Americans think inflation in the one and five years horizon would ease, from 3.4% to 3.3% and from 3% to 2.9%, respectively.
In the meantime, the US Dollar Index (DXY), a basket of six currencies vs. the Greenback, stands flat at 102.619, although higher US Treasury bond yields would suggest a stronger US Dollar. The US 10-year benchmark note sits at 4.125%, gains one basis point.
Across the pond, the Eurozone (EU) docket featured inflation data in France and Spain, which showed mixed readings, as France’s inflation was below June’s figures, while Spain’s inflation was above the prior’s month but as expected. In the meantime, a Reuters poll showed that 37 of 70 economists expect the European Central Bank (ECB) to keep rates unchanged in September. Suppose the ECB raises borrowing costs past 4%. It would be the highest deposit rate since the Euro’s introduction in 1999.
Although the interest rates differential favors the US Dollar, uncertainty in the US and the Eurozone could keep choppy trading conditions. Nevertheless, the next week’s EU docket would be busy compared to the US, and if inflation figures show an improvement, that could be bearish for the EUR.
After reaching a weekly high of 1.1065 after the release of US consumer inflation, the pair failed to regain the 1.1000 mark, opening the door for further losses. On the upside, EUR/USD price action is capped by the 20-day Exponential Moving Average (EMA) at 1.1003, followed by a two-month-old resistance turned trendline, previous support at around 1.1030/50. With the Relative Strength Index (RSI) remaining at bearish territory and price action failing to achieve a higher peak, the EUR/USD could dip lower, with support emerging at 1.0950, before falling to its month-to-date (MTD) low of 1.0912.
Technical Levels: Supports and Resistances
EURUSD currently trading at 1.0959 at the time of writing. Pair opened at 1.0981 and is trading with a change of -0.2 % .
| Overview | Overview.1 | |
|---|---|---|
| 0 | Today last price | 1.0959 |
| 1 | Today Daily Change | -0.0022 |
| 2 | Today Daily Change % | -0.2000 |
| 3 | Today daily open | 1.0981 |
The pair is trading below its 20 Daily moving average @ 1.1057, above its 50 Daily moving average @ 1.0957 , above its 100 Daily moving average @ 1.0928 and above its 200 Daily moving average @ 1.0768
| Trends | Trends.1 | |
|---|---|---|
| 0 | Daily SMA20 | 1.1057 |
| 1 | Daily SMA50 | 1.0957 |
| 2 | Daily SMA100 | 1.0928 |
| 3 | Daily SMA200 | 1.0768 |
The previous day high was 1.1065 while the previous day low was 1.0967. The daily 38.2% Fib levels comes at 1.1028, expected to provide resistance. Similarly, the daily 61.8% fib level is at 1.1005, expected to provide resistance.
Note the levels of interest below:
- Pivot support is noted at 1.0944, 1.0907, 1.0846
- Pivot resistance is noted at 1.1042, 1.1102, 1.114
| Levels | Levels.1 |
|---|---|
| Previous Daily High | 1.1065 |
| Previous Daily Low | 1.0967 |
| Previous Weekly High | 1.1046 |
| Previous Weekly Low | 1.0912 |
| Previous Monthly High | 1.1276 |
| Previous Monthly Low | 1.0834 |
| Daily Fibonacci 38.2% | 1.1028 |
| Daily Fibonacci 61.8% | 1.1005 |
| Daily Pivot Point S1 | 1.0944 |
| Daily Pivot Point S2 | 1.0907 |
| Daily Pivot Point S3 | 1.0846 |
| Daily Pivot Point R1 | 1.1042 |
| Daily Pivot Point R2 | 1.1102 |
| Daily Pivot Point R3 | 1.1140 |
[/s2If]
Download Nehcap EAWe have two EAs that are operational on our LIVE accounts.
- EA-FIX: Check out the details here. Download EA-FIX . EA-FIX is a non-grid HFT scalper.
- EA-GROWTH: High quality low dd EA using trend grids. Download EA_GROWTHJoin Our Telegram Group
")


