Bullish momentum for EURUSD is weakening as they struggle to maintain control, achieving only small gains over a three-day period. The viewpoint of @nehcap suggests that any potential rebound will be minimal.
…
This is a premium post.
[s2If !current_user_can(access_s2member_level4)]Please register for FREE REGISTER to read full post below containing analysis. In case of any error or you think you are not able to read the full post below, please email us at support#nehcap.com [lwa][/s2If] [s2If current_user_can(access_s2member_level1)]
- EUR/USD bulls struggle to keep the reins, posting minor gains during three-day winning streak.
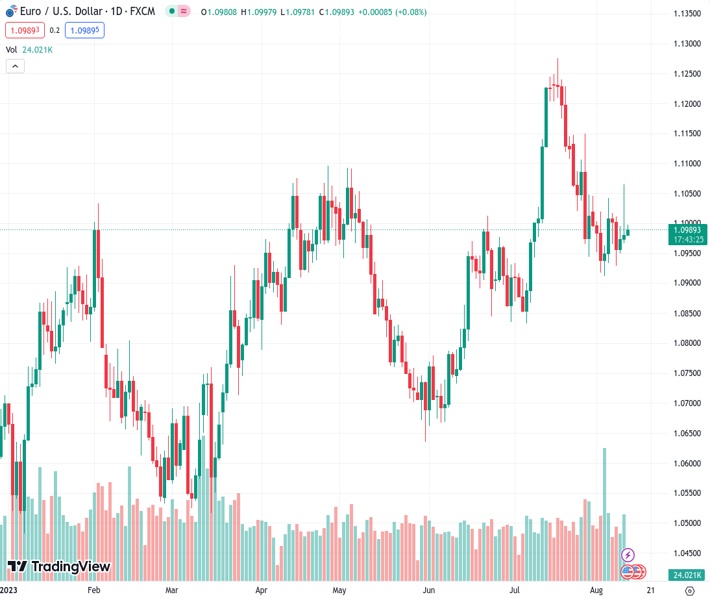
The pair currently trades last at 1.09902.
The previous day high was 1.1065 while the previous day low was 1.0967. The daily 38.2% Fib levels comes at 1.1028, expected to provide resistance. Similarly, the daily 61.8% fib level is at 1.1005, expected to provide resistance.
EUR/USD clings to mild gains around 1.0990 as it struggles to defend the three-day uptrend during early Friday morning in Europe, especially amid the mixed bias about the European Central Bank (ECB) and the Federal Reserve (Fed). Also challenging the Euro pair is the presence of more clues of the US inflation conditions on the economic calendar.
Also read: EUR/USD steadies below 1.1000 as Fed officials welcome US inflation data, ECB signals uncertain times
Technically, a clear upside break of the previous key resistance line stretched from July 18, now immediate support around 1.0960, restricts the immediate downside of the EUR/USD pair.
Adding strength to the bullish bias is the pair’s successful trading above a one-month-old rising support line surrounding 1.0940, as well as the upward-sloping RSI (14) line, not overbought.
It’s worth noting that the monthly bottom of around 1.0910 and the 1.0900 round figure also challenge the EUR/USD bears.
On the flip side, the 100-SMA pierces the 200-SMA from above and teases a Bear Cross while challenging the Euro buyers below the 1.1025 SMA confluence.
Even if the EUR/USD pair crosses the 1.1025 hurdle, a one-month-old horizontal resistance area near 1.1040 appears a tough nut to crack for the bulls.
Trend: Limited recovery expected
Technical Levels: Supports and Resistances
EURUSD currently trading at 1.0989 at the time of writing. Pair opened at 1.0981 and is trading with a change of 0.07% % .
| Overview | Overview.1 | |
|---|---|---|
| 0 | Today last price | 1.0989 |
| 1 | Today Daily Change | 0.0008 |
| 2 | Today Daily Change % | 0.07% |
| 3 | Today daily open | 1.0981 |
The pair is trading below its 20 Daily moving average @ 1.1057, above its 50 Daily moving average @ 1.0957 , above its 100 Daily moving average @ 1.0928 and above its 200 Daily moving average @ 1.0768
| Trends | Trends.1 | |
|---|---|---|
| 0 | Daily SMA20 | 1.1057 |
| 1 | Daily SMA50 | 1.0957 |
| 2 | Daily SMA100 | 1.0928 |
| 3 | Daily SMA200 | 1.0768 |
The previous day high was 1.1065 while the previous day low was 1.0967. The daily 38.2% Fib levels comes at 1.1028, expected to provide resistance. Similarly, the daily 61.8% fib level is at 1.1005, expected to provide resistance.
Note the levels of interest below:
- Pivot support is noted at 1.0944, 1.0907, 1.0846
- Pivot resistance is noted at 1.1042, 1.1102, 1.114
| Levels | Levels.1 |
|---|---|
| Previous Daily High | 1.1065 |
| Previous Daily Low | 1.0967 |
| Previous Weekly High | 1.1046 |
| Previous Weekly Low | 1.0912 |
| Previous Monthly High | 1.1276 |
| Previous Monthly Low | 1.0834 |
| Daily Fibonacci 38.2% | 1.1028 |
| Daily Fibonacci 61.8% | 1.1005 |
| Daily Pivot Point S1 | 1.0944 |
| Daily Pivot Point S2 | 1.0907 |
| Daily Pivot Point S3 | 1.0846 |
| Daily Pivot Point R1 | 1.1042 |
| Daily Pivot Point R2 | 1.1102 |
| Daily Pivot Point R3 | 1.1140 |
[/s2If]
Download Nehcap EAWe have two EAs that are operational on our LIVE accounts.
- EA-FIX: Check out the details here. Download EA-FIX . EA-FIX is a non-grid HFT scalper.
- EA-GROWTH: High quality low dd EA using trend grids. Download EA_GROWTHJoin Our Telegram Group
")


