According to a Twitter post, the exchange rate between the US dollar and Canadian dollar is being negatively affected, staying at a low point after a turbulent Thursday. The person who posted this believes that there is not much more potential for the exchange rate to decrease significantly.
…
This is a premium post.
[s2If !current_user_can(access_s2member_level4)]Please register for FREE REGISTER to read full post below containing analysis. In case of any error or you think you are not able to read the full post below, please email us at support#nehcap.com [lwa][/s2If] [s2If current_user_can(access_s2member_level1)]
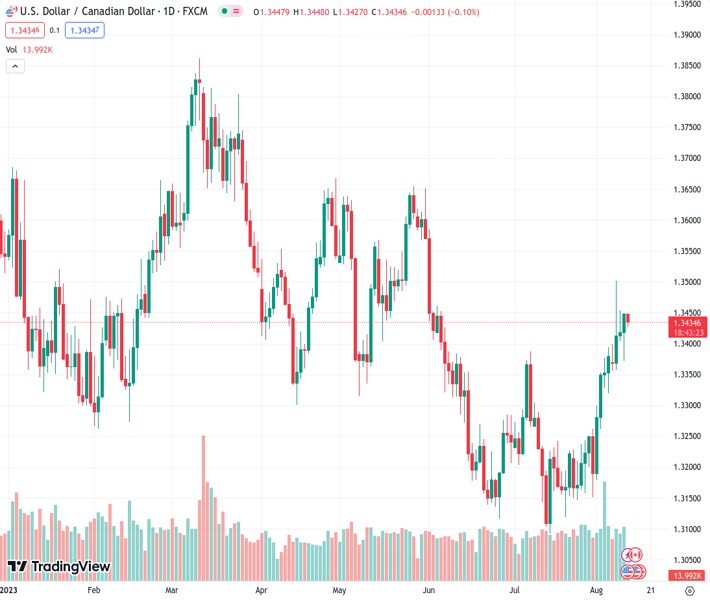
- USD/CAD remains pressured at intraday low after volatile Thursday.
The pair currently trades last at 1.34351.
The previous day high was 1.345 while the previous day low was 1.3373. The daily 38.2% Fib levels comes at 1.3421, expected to provide support. Similarly, the daily 61.8% fib level is at 1.3402, expected to provide support.
USD/CAD clings to mild losses around 1.3430 during early Friday, following the failure to cross the key upside hurdle despite an interesting bullish close to the volatile day. In doing so, the Loonie pair justifies technical signals while waiting for additional details to confirm the recent dovish bias about the Federal Reserve (Fed), especially after the previous day’s downbeat US data.
Among the US statistics, the Producer Price Index (PPI) for July and the first readings of the University of Michigan’s (UoM) Consumer Sentiment Index (CSI) for August will be crucial to watch for clear directions.
Also read:
That said, USD/CAD reverses from a joint of the 200-DMA and a downward-sloping resistance line from May 31, close to 1.3450 by the press time.
However, the bullish MACD signals suggest limited downside room for the Loonie pair, which in turn highlights a convergence of the 100-DMA and a two-month-old horizontal support zone, close to 1.3390-80.
It’s worth noting that the quote’s downside break of 1.3380 will make it vulnerable to drop toward April’s low of around 1.3300.
On the contrary, a daily closing beyond the 1.3450 resistance confluence could quickly propel the USD/CAD prices to the monthly high marked on Monday at around 1.3505.
Following that, tops marked in May and April, respectively near 1.3655 and 1.3670, will be in the spotlight.
Trend: Limited downside expected
Technical Levels: Supports and Resistances
USDCAD currently trading at 1.3434 at the time of writing. Pair opened at 1.3449 and is trading with a change of -0.11% % .
| Overview | Overview.1 | |
|---|---|---|
| 0 | Today last price | 1.3434 |
| 1 | Today Daily Change | -0.0015 |
| 2 | Today Daily Change % | -0.11% |
| 3 | Today daily open | 1.3449 |
The pair is trading above its 20 Daily moving average @ 1.3269, above its 50 Daily moving average @ 1.3268 , above its 100 Daily moving average @ 1.3391 and below its 200 Daily moving average @ 1.3451
| Trends | Trends.1 | |
|---|---|---|
| 0 | Daily SMA20 | 1.3269 |
| 1 | Daily SMA50 | 1.3268 |
| 2 | Daily SMA100 | 1.3391 |
| 3 | Daily SMA200 | 1.3451 |
The previous day high was 1.345 while the previous day low was 1.3373. The daily 38.2% Fib levels comes at 1.3421, expected to provide support. Similarly, the daily 61.8% fib level is at 1.3402, expected to provide support.
Note the levels of interest below:
- Pivot support is noted at 1.3398, 1.3346, 1.332
- Pivot resistance is noted at 1.3475, 1.3502, 1.3553
| Levels | Levels.1 |
|---|---|
| Previous Daily High | 1.3450 |
| Previous Daily Low | 1.3373 |
| Previous Weekly High | 1.3394 |
| Previous Weekly Low | 1.3151 |
| Previous Monthly High | 1.3387 |
| Previous Monthly Low | 1.3093 |
| Daily Fibonacci 38.2% | 1.3421 |
| Daily Fibonacci 61.8% | 1.3402 |
| Daily Pivot Point S1 | 1.3398 |
| Daily Pivot Point S2 | 1.3346 |
| Daily Pivot Point S3 | 1.3320 |
| Daily Pivot Point R1 | 1.3475 |
| Daily Pivot Point R2 | 1.3502 |
| Daily Pivot Point R3 | 1.3553 |
[/s2If]
Download Nehcap EAWe have two EAs that are operational on our LIVE accounts.
- EA-FIX: Check out the details here. Download EA-FIX . EA-FIX is a non-grid HFT scalper.
- EA-GROWTH: High quality low dd EA using trend grids. Download EA_GROWTHJoin Our Telegram Group
")


