The USDCAD pair is experiencing downward pressure after previously reaching a two-month high. According to the view of @nehcap, it is anticipated that there will be further increase in price.
…
This is a premium post.
[s2If !current_user_can(access_s2member_level4)]Please register for FREE REGISTER to read full post below containing analysis. In case of any error or you think you are not able to read the full post below, please email us at support#nehcap.com [lwa][/s2If] [s2If current_user_can(access_s2member_level1)]
- USD/CAD remains pressured after reversing from two-month high.
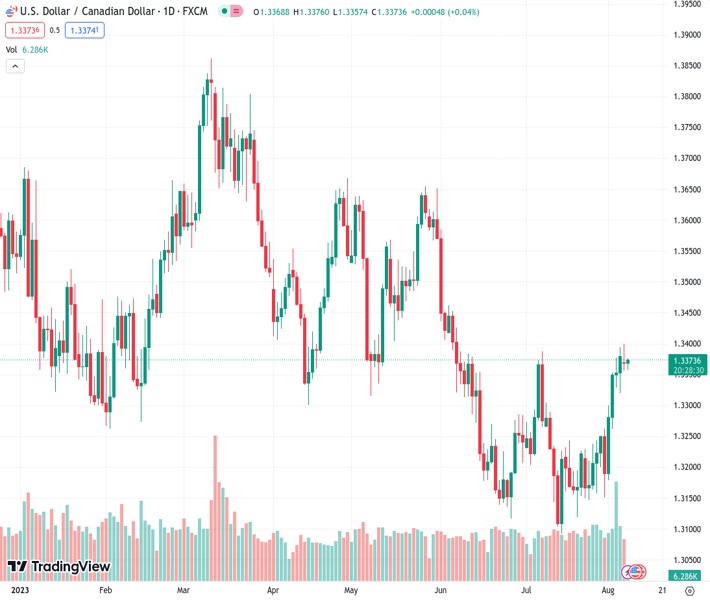
The pair currently trades last at 1.33727.
The previous day high was 1.3399 while the previous day low was 1.3356. The daily 38.2% Fib levels comes at 1.3373, expected to provide resistance. Similarly, the daily 61.8% fib level is at 1.3383, expected to provide resistance.
USD/CAD stays depressed near 1.3370 after reversing from the highest level in two months the previous day. That said, the Loonie pair snapped a four-day uptrend the previous day before posting a lackluster start to the Asian session on Tuesday.
USD/CAD took a U-turn from the 100-DMA and closed beneath a two-month-old horizontal resistance to lure the Loonie (CAD) buyers. However, the bullish MACD signals for the pair and the upbeat RSI (14) line, not overbought, suggests further upside of the quote.
Hence, USD/CAD may witness a slower grind toward the north wherein the aforementioned horizontal resistance zone surrounding 1.3390 and the 100-DMA hurdle of around 1.3400 could restrict the short-term upside of the Loonie pair.
Following that, a downward-sloping resistance line from early March and the 200-DMA, respectively near 1.3435 and 1.3455, will act as the final defense of the USD/CAD bears.
On the contrary, the monthly lows of May and April, close to 1.3315 and 1.3300 in that order, can lure the short-term sellers of the USD/CAD pair ahead of the 50-DMA level of 1.3270.
It’s worth noting, however, that a daily closing below the 50-DMA support of 1.3270 will make the USD/CAD pair vulnerable to drop towards a three-week-old rising support line near 1.3180.
Trend: Further upside expected
Technical Levels: Supports and Resistances
USDCAD currently trading at 1.3372 at the time of writing. Pair opened at 1.337 and is trading with a change of 0.01% % .
| Overview | Overview.1 | |
|---|---|---|
| 0 | Today last price | 1.3372 |
| 1 | Today Daily Change | 0.0002 |
| 2 | Today Daily Change % | 0.01% |
| 3 | Today daily open | 1.337 |
The pair is trading above its 20 Daily moving average @ 1.3231, above its 50 Daily moving average @ 1.3275 , below its 100 Daily moving average @ 1.3399 and below its 200 Daily moving average @ 1.3455
| Trends | Trends.1 | |
|---|---|---|
| 0 | Daily SMA20 | 1.3231 |
| 1 | Daily SMA50 | 1.3275 |
| 2 | Daily SMA100 | 1.3399 |
| 3 | Daily SMA200 | 1.3455 |
The previous day high was 1.3399 while the previous day low was 1.3356. The daily 38.2% Fib levels comes at 1.3373, expected to provide resistance. Similarly, the daily 61.8% fib level is at 1.3383, expected to provide resistance.
Note the levels of interest below:
- Pivot support is noted at 1.3351, 1.3332, 1.3307
- Pivot resistance is noted at 1.3394, 1.3418, 1.3438
| Levels | Levels.1 |
|---|---|
| Previous Daily High | 1.3399 |
| Previous Daily Low | 1.3356 |
| Previous Weekly High | 1.3394 |
| Previous Weekly Low | 1.3151 |
| Previous Monthly High | 1.3387 |
| Previous Monthly Low | 1.3093 |
| Daily Fibonacci 38.2% | 1.3373 |
| Daily Fibonacci 61.8% | 1.3383 |
| Daily Pivot Point S1 | 1.3351 |
| Daily Pivot Point S2 | 1.3332 |
| Daily Pivot Point S3 | 1.3307 |
| Daily Pivot Point R1 | 1.3394 |
| Daily Pivot Point R2 | 1.3418 |
| Daily Pivot Point R3 | 1.3438 |
[/s2If]
Download Nehcap EAWe have two EAs that are operational on our LIVE accounts.
- EA-FIX: Check out the details here. Download EA-FIX . EA-FIX is a non-grid HFT scalper.
- EA-GROWTH: High quality low dd EA using trend grids. Download EA_GROWTHJoin Our Telegram Group


