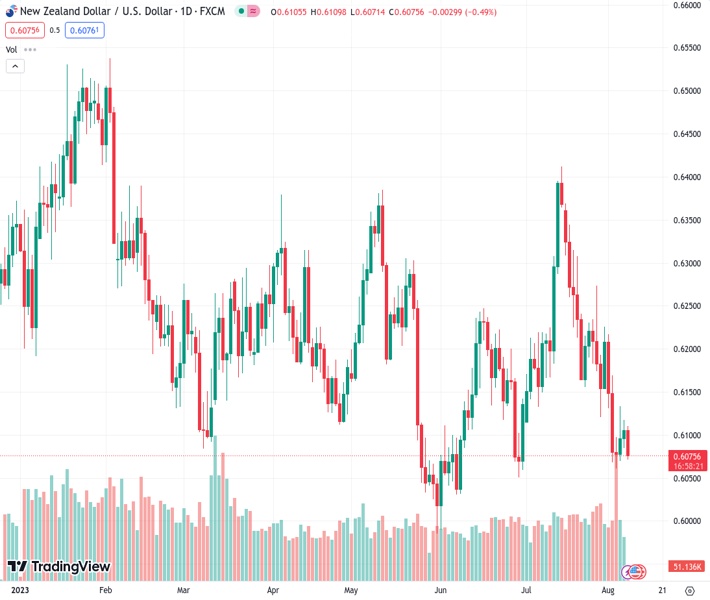
NZDUSD, trading at a level of 0.60793, faces increased selling activity on Tuesday due to a small increase in strength of the USD.
…
This is a premium post.
[s2If !current_user_can(access_s2member_level4)]Please register for FREE REGISTER to read full post below containing analysis. In case of any error or you think you are not able to read the full post below, please email us at support#nehcap.com [lwa][/s2If] [s2If current_user_can(access_s2member_level1)]
- NZD/USD comes under some renewed selling pressure on Tuesday amid a modest USD strength.
The pair currently trades last at 0.60793.
The previous day high was 0.6118 while the previous day low was 0.6084. The daily 38.2% Fib levels comes at 0.6105, expected to provide resistance. Similarly, the daily 61.8% fib level is at 0.6097, expected to provide resistance.
The NZD/USD pair struggles to capitalize on its modest gains registered over the past two trading days and meets with a fresh supply during the Asian session on Tuesday. Spot prices, however, manage to recover a few pips from the daily low touched in the last hour and currently trade just below the 0.6100 mark, still down nearly 0.30% for the day.
The better-than-expected release of Trade Balance data from China, showing that the surplus rose to $80.6 billion in Jul from $70.62 billion in the previous month, lends some support to antipodean currencies, including the New Zealand Dollar (NZD). Additional details of the report, however, showed that imports slumped 12.4% YoY and exports dropped 9.2% YoY, indicating weaker domestic and overseas demand. This, along with a softer tone around the Asian equity markets and the emergence of some US Dollar (USD) buying, keeps a lid on any meaningful upside for the NZD/USD pair.
In fact, the USD Index (DXY), which tracks the Greenback against a basket of currencies, gains some positive traction for the second straight day and continues to draw support from expectations for further policy tightening by the Federal Reserve (Fed). The bets were lifted by the latest US monthly jobs report released on Friday, which pointed to continued tightness in the labour market and should allow the Fed to stick to its hawkish stance. Adding to this, Fed Governor Michele Bowman said on Monday that additional interest rate hikes will likely be needed to lower inflation to the central bank’s 2% target.
In remarks prepared for delivery to a “Fed Listens” event in Atlanta, Bowman added that inflation remains too elevated, and job growth and other indications of activity show the economy has continued expanding at a “moderate pace.” This keeps the door for one more 25 bps lift-off in September or November wide open and remains supportive of elevated US Treasury bond yields, which, in turn, is seen acting as a tailwind for the Greenback. The fundamental backdrop favours the USD bulls and suggests that the path of least resistance for the NZD/USD pair remains to the downside.
Hence, any attempted recovery might still be seen as a selling opportunity and runs the risk of fizzling out rather quickly. Bearish traders, however, need to wait for a sustained break below the 0.6500 psychological mark before positioning for any further losses. Market participants now look to the release of the US Trade balance data for some impetus later during the early North American session. The focus, however, will remain glued to the latest consumer inflation figures from China and the US, due for release on Wednesday and Thursday, respectively.
Technical Levels: Supports and Resistances
NZDUSD currently trading at 0.6084 at the time of writing. Pair opened at 0.6107 and is trading with a change of -0.38 % .
| Overview | Overview.1 | |
|---|---|---|
| 0 | Today last price | 0.6084 |
| 1 | Today Daily Change | -0.0023 |
| 2 | Today Daily Change % | -0.3800 |
| 3 | Today daily open | 0.6107 |
The pair remains strongly bearish on the daily time frame. It trades below the 20 SMA @ 0.621, 50 SMA 0.6166, 100 SMA @ 0.6192 and 200 SMA @ 0.6229.
| Trends | Trends.1 | |
|---|---|---|
| 0 | Daily SMA20 | 0.6210 |
| 1 | Daily SMA50 | 0.6166 |
| 2 | Daily SMA100 | 0.6192 |
| 3 | Daily SMA200 | 0.6229 |
The previous day high was 0.6118 while the previous day low was 0.6084. The daily 38.2% Fib levels comes at 0.6105, expected to provide resistance. Similarly, the daily 61.8% fib level is at 0.6097, expected to provide resistance.
Note the levels of interest below:
- Pivot support is noted at 0.6088, 0.6069, 0.6054
- Pivot resistance is noted at 0.6122, 0.6137, 0.6156
| Levels | Levels.1 |
|---|---|
| Previous Daily High | 0.6118 |
| Previous Daily Low | 0.6084 |
| Previous Weekly High | 0.6226 |
| Previous Weekly Low | 0.6060 |
| Previous Monthly High | 0.6413 |
| Previous Monthly Low | 0.6120 |
| Daily Fibonacci 38.2% | 0.6105 |
| Daily Fibonacci 61.8% | 0.6097 |
| Daily Pivot Point S1 | 0.6088 |
| Daily Pivot Point S2 | 0.6069 |
| Daily Pivot Point S3 | 0.6054 |
| Daily Pivot Point R1 | 0.6122 |
| Daily Pivot Point R2 | 0.6137 |
| Daily Pivot Point R3 | 0.6156 |
[/s2If]
Download Nehcap EAWe have two EAs that are operational on our LIVE accounts.
- EA-FIX: Check out the details here. Download EA-FIX . EA-FIX is a non-grid HFT scalper.
- EA-GROWTH: High quality low dd EA using trend grids. Download EA_GROWTHJoin Our Telegram Group


