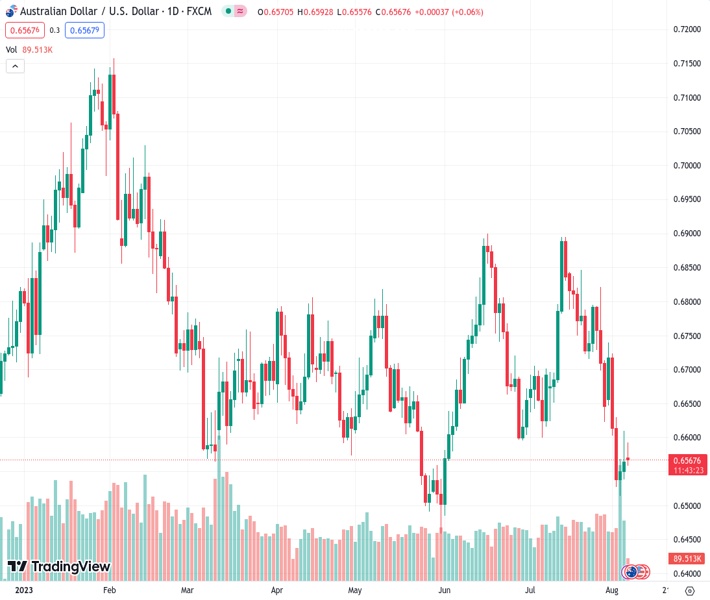
The AUDUSD pair encounters resistance during Monday’s trading session at a price of 0.65660 due to increasing demand for the USD.
…
This is a premium post.
[s2If !current_user_can(access_s2member_level4)]Please register for FREE REGISTER to read full post below containing analysis. In case of any error or you think you are not able to read the full post below, please email us at support#nehcap.com [lwa][/s2If] [s2If current_user_can(access_s2member_level1)]
- AUD/USD meets with some intraday supply on Monday and is pressured by reviving USD demand.
The pair currently trades last at 0.65660.
The previous day high was 0.661 while the previous day low was 0.6543. The daily 38.2% Fib levels comes at 0.6584, expected to provide resistance. Similarly, the daily 61.8% fib level is at 0.6568, expected to provide resistance.
The AUD/USD pair comes under some selling pressure following an intraday uptick to the 0.6600 neighbourhood and drops to a fresh daily low during the early part of the European session on Monday. Spot prices currently trade around the 0.6560 area and seem poised to resume the recent downward trajectory witnessed over the past three weeks or so.
The US Dollar kicks off the new week on a positive note and stalls a two-day-old corrective slide from its highest level since July 7 touched last Thursday, which, in turn, acts as a headwind for the AUD/USD pair. The closely-watched US NFP report showed that the economy maintained a moderate pace of job addition in July, though solid wage growth and an unexpected dip in the unemployment rate pointed to continued tightness in labour market conditions. This could allow the Federal Reserve (Fed) to stick to its hawkish stance and keep the door for one more 25 bps lift-off in September or November. The expectations trigger a modest recovery in the US Treasury bond yields and help revive demand for the Greenback.
Apart from this, a generally weaker tone around the global equity markets is seen as another factor driving flows away from the risk-sensitive Australian Dollar (AUD). Investors remain concerned that the post-COVID recovery in China – the world’s second-largest economy – is losing steam, which, to a larger extent, overshadows the latest optimism over additional stimulus. Even the Reserve Bank of Australia’s (RBA) hawkish quarterly Monetary Policy Statement (MPS) released on Friday, indicating that rates may still need to go higher, does little to lend any support to the AUD/USD pair. This, in turn, suggests that the path of least resistance for spot prices is to the downside and validates the near-term negative outlook.
Moving ahead, there isn’t any relevant market-moving economic data due for release from the US on Monday. Hence, traders will look to speeches by influential FOMC members for cues about the future rate-hike path. This, along with the US bond yields and the broader risk sentiment, will drive the USD demand and produce short-term opportunities around the AUD/USD pair. The focus, however, will remain glued to the latest consumer inflation figures from China and the US, due on Wednesday and Thursday, which will play a key role in providing a fresh directional impetus to the major.
Technical Levels: Supports and Resistances
AUDUSD currently trading at 0.6565 at the time of writing. Pair opened at 0.6569 and is trading with a change of -0.06 % .
| Overview | Overview.1 | |
|---|---|---|
| 0 | Today last price | 0.6565 |
| 1 | Today Daily Change | -0.0004 |
| 2 | Today Daily Change % | -0.0600 |
| 3 | Today daily open | 0.6569 |
The pair remains strongly bearish on the daily time frame. It trades below the 20 SMA @ 0.6721, 50 SMA 0.6702, 100 SMA @ 0.6689 and 200 SMA @ 0.6733.
| Trends | Trends.1 | |
|---|---|---|
| 0 | Daily SMA20 | 0.6721 |
| 1 | Daily SMA50 | 0.6702 |
| 2 | Daily SMA100 | 0.6689 |
| 3 | Daily SMA200 | 0.6733 |
The previous day high was 0.661 while the previous day low was 0.6543. The daily 38.2% Fib levels comes at 0.6584, expected to provide resistance. Similarly, the daily 61.8% fib level is at 0.6568, expected to provide resistance.
Note the levels of interest below:
- Pivot support is noted at 0.6538, 0.6507, 0.6471
- Pivot resistance is noted at 0.6605, 0.6641, 0.6672
| Levels | Levels.1 |
|---|---|
| Previous Daily High | 0.6610 |
| Previous Daily Low | 0.6543 |
| Previous Weekly High | 0.6740 |
| Previous Weekly Low | 0.6514 |
| Previous Monthly High | 0.6895 |
| Previous Monthly Low | 0.6599 |
| Daily Fibonacci 38.2% | 0.6584 |
| Daily Fibonacci 61.8% | 0.6568 |
| Daily Pivot Point S1 | 0.6538 |
| Daily Pivot Point S2 | 0.6507 |
| Daily Pivot Point S3 | 0.6471 |
| Daily Pivot Point R1 | 0.6605 |
| Daily Pivot Point R2 | 0.6641 |
| Daily Pivot Point R3 | 0.6672 |
[/s2If]
Download Nehcap EAWe have two EAs that are operational on our LIVE accounts.
- EA-FIX: Check out the details here. Download EA-FIX . EA-FIX is a non-grid HFT scalper.
- EA-GROWTH: High quality low dd EA using trend grids. Download EA_GROWTHJoin Our Telegram Group


