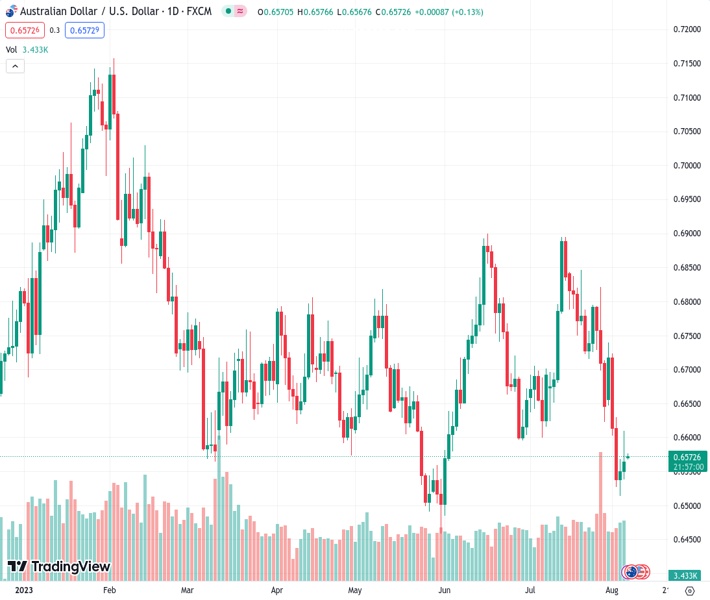
Despite starting the week’s trading quietly, the AUDUSD currency pair remains resilient at 0.65735, defending the rebound from the previous day.
…
This is a premium post.
[s2If !current_user_can(access_s2member_level4)]Please register for FREE REGISTER to read full post below containing analysis. In case of any error or you think you are not able to read the full post below, please email us at support#nehcap.com [lwa][/s2If] [s2If current_user_can(access_s2member_level1)]
- AUD/USD defends the previous day’s corrective bounce despite posting muted start of week’s trading.
The pair currently trades last at 0.65735.
The previous day high was 0.661 while the previous day low was 0.6543. The daily 38.2% Fib levels comes at 0.6584, expected to provide resistance. Similarly, the daily 61.8% fib level is at 0.6568, expected to provide support.
AUD/USD kick-starts the inflation week with no major changes, making rounds to around 0.6570, defending the last two days’ corrective bounce off the key support line during the early Asian session on Monday. In doing so, the Aussie pair justifies the market’s cautious mood ahead of the top-tier inflation clues from Australia and the US, as well as the lack of major data/events during the weekend. It’s worth noting that the Aussie pair marked a three-week downtrend despite recovering in the last two consecutive days.
The Aussie pair’s latest rebound could be linked to the mixed US data and upbeat statements from the Reserve Bank of Australia (RBA). However, fears emanating from the US credit rating downgrade by Fitch Ratings and China’s economic worries, despite announcing multiple stimulus measures, prod the Aussie buyers ahead of the key inflation data.
During the last week, the Reserve Bank of Australia (RBA) defied market forecasts by keeping the benchmark rates intact at 4.1%, marking the second consecutive status quo after challenging the two hawkish surprises in the last monetary policy meeting in July. However, the Aussie central bank’s rate statement, presented by Governor Phillip Lowe, mentioned, “Some further tightening of monetary policy may be required to ensure that inflation returns to target in a reasonable timeframe, but that will depend upon the data and the evolving assessment of risks.” Furthermore, the RBA’s quarterly print of the Monetary Policy Statement (MPS) confirmed the Aussie central bank’s hawkish bias by suggesting the need for further tightening. “Trims GDP growth and inflation forecasts for end 2023, most others little changed,” said the RBA statement.
On the other hand, the headline US employment report posted a softer-than-expected Nonfarm Payrolls (NFP) figure of 187K, versus 185K prior (revised) and 200K market forecasts, whereas the Unemployment Rate eased to 3.5% from 3.6% expected and previous readings. Further, the Average Hourly Earnings reprinted 0.4% MoM and 4.4% YoY numbers by defying the expectations of witnessing a slight reduction in wage growth.
Also notable is the fact that the ISM Manufacturing PMI for July improved a bit but the more important Services PMI dropped for the said month. Additionally, US Factory Orders edged higher for June and so did the second-tier employment-linked data like Nonfarm Productivity and JOLT Job Openings. However, the Q2 Unit Labor Cost eased and troubled favoring the Fed’s September rate hike.
Considering these data, the market’s bets on the Fed’s September rate hike eased from 20.0% to 13% on a weekly basis, per the CME’s FedWatch Tool.
With this in mind, Atlanta Federal Reserve Bank President Raphael Bostic said on Friday to Bloomberg, that the central bank is likely to keep monetary policy in a restrictive territory well into 2024. On the contrary, Chicago Fed President Austan Goolsbee stated that they should start thinking about how long to hold rates.
Elsewhere, China’s Caixin Manufacturing PMI improved but the Services PMI eased in July while the policymakers tried to placate bears by announcing several stimulus measures to defend the economy.
To sum up, most of the United States statistics have been mixed and may not be the key reason for the US Dollar Index (DXY) run-up, which in turn highlights the Fitch Ratings’ downward revision to the US credit rating from AAA to AA+. The same joins the US-China tension and mixed earnings from the US corporate giants to spoil the sentiment and weigh on the AUD/USD price.
Moving on, this week’s US inflation numbers, namely the Consumer Price Index (CPI) and Producer Price Index (PPI) for July for clear directions. Also important to watch will be Australia’s Consumer Inflation Expectations for August. Should the inflation numbers from Canberra improve and the US CPI/PPI ease, the AUD/USD may have a reason to extend the latest rebound from the key support.
AUD/USD recovery could be linked to the inability to break a 10-month-old rising support line, around 0.6540 by the press time and the nearly oversold RSI (14) line. However, a daily closing beyond the lows marked in late June and early July, close to 0.6600, becomes necessary to convince buyers.
Technical Levels: Supports and Resistances
AUDUSD currently trading at 0.6573 at the time of writing. Pair opened at 0.6569 and is trading with a change of 0.06% % .
| Overview | Overview.1 | |
|---|---|---|
| 0 | Today last price | 0.6573 |
| 1 | Today Daily Change | 0.0004 |
| 2 | Today Daily Change % | 0.06% |
| 3 | Today daily open | 0.6569 |
The pair remains strongly bearish on the daily time frame. It trades below the 20 SMA @ 0.6721, 50 SMA 0.6702, 100 SMA @ 0.6689 and 200 SMA @ 0.6733.
| Trends | Trends.1 | |
|---|---|---|
| 0 | Daily SMA20 | 0.6721 |
| 1 | Daily SMA50 | 0.6702 |
| 2 | Daily SMA100 | 0.6689 |
| 3 | Daily SMA200 | 0.6733 |
The previous day high was 0.661 while the previous day low was 0.6543. The daily 38.2% Fib levels comes at 0.6584, expected to provide resistance. Similarly, the daily 61.8% fib level is at 0.6568, expected to provide support.
Note the levels of interest below:
- Pivot support is noted at 0.6538, 0.6507, 0.6471
- Pivot resistance is noted at 0.6605, 0.6641, 0.6672
| Levels | Levels.1 |
|---|---|
| Previous Daily High | 0.6610 |
| Previous Daily Low | 0.6543 |
| Previous Weekly High | 0.6740 |
| Previous Weekly Low | 0.6514 |
| Previous Monthly High | 0.6895 |
| Previous Monthly Low | 0.6599 |
| Daily Fibonacci 38.2% | 0.6584 |
| Daily Fibonacci 61.8% | 0.6568 |
| Daily Pivot Point S1 | 0.6538 |
| Daily Pivot Point S2 | 0.6507 |
| Daily Pivot Point S3 | 0.6471 |
| Daily Pivot Point R1 | 0.6605 |
| Daily Pivot Point R2 | 0.6641 |
| Daily Pivot Point R3 | 0.6672 |
[/s2If]
Download Nehcap EAWe have two EAs that are operational on our LIVE accounts.
- EA-FIX: Check out the details here. Download EA-FIX . EA-FIX is a non-grid HFT scalper.
- EA-GROWTH: High quality low dd EA using trend grids. Download EA_GROWTHJoin Our Telegram Group


