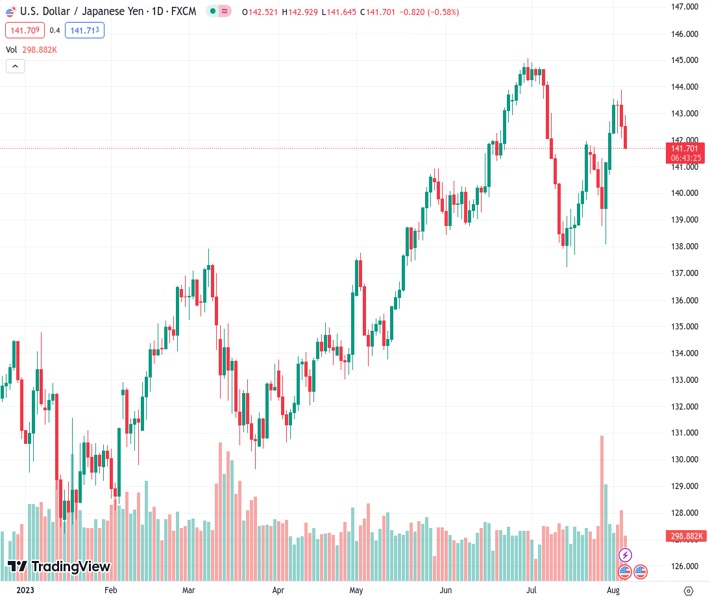
The USDJPY currency pair, currently at 141.813, experienced a decline below the 142 mark, decreasing by 0.47%. This drop occurred following the release of US employment data indicating a reduction in job market strength and adjustments made by the Bank of Japan to its Yield Curve Control (YCC) policy.
…
This is a premium post.
[s2If !current_user_can(access_s2member_level4)]Please register for FREE REGISTER to read full post below containing analysis. In case of any error or you think you are not able to read the full post below, please email us at support#nehcap.com [lwa][/s2If] [s2If current_user_can(access_s2member_level1)]
- USD/JPY dipped below 142, down 0.47%, after the US jobs data showed easing in the labor market and BoJ’s tweaks to its YCC.
The pair currently trades last at 141.813.
The previous day high was 143.89 while the previous day low was 142.06. The daily 38.2% Fib levels comes at 142.76, expected to provide resistance. Similarly, the daily 61.8% fib level is at 143.19, expected to provide resistance.
USD/JPY prolonged its losses to two consecutive days, as jobs data from the United States (US) indeed showed the labor market is easing, while the Bank of Japan’s (BoJ) recent tweak to its Yield Curve Control (YCC) boosted the Japanese Yen (JPY) against the US Dollar (USD). Hence, the USD/JPY is trading at 141.82 after hitting a daily high of 142.92, down 0.47%.
Wall Street opened on a higher note after the US Bureau of Labor Statistics (BLS) revealed July’s Nonfarm Payroll figures which missed estimates of 200K, decelerating to 187K. Although the data could encourage the Federal Reserve (Fed) to skip a rate hike in September, Average Hourly Earnings rose by 4.4% YoYs, exceeding estimates of 4.2%, while the Unemployment Rate climbed by 3.6%, a tick up from 3.5%.
Consequently, the US Treasury bond yield, mainly the 10-year benchmark note, has erased seven basis points of gain compared to yesterday’s, stands at 4.119%, a headwind for the USD/JPY pair, which correlates positively to US bond yield, as traders take advantage of the carry trade.
Nevertheless, the BoJ’s decision to give flexibility to its YCC, within the 0.50%-1%, keeps speculators guessing, which would be the peak for the BoJ, as the bank has continued to exercise unscheduled bond-buying operations in the market.
In the meantime, the US Dollar Index (DXY), which tracks the buck’s performance against a basket of peers, sheds more than 0.50%, exchanging hands at 101.944, forming an evening-star three-candle pattern, warranting further downside expected.
Ahead into the next week, the US economic agenda will feature July’s inflation report, the Balance of Trade, and Fed speakers as the main highlight. On the Japanese front, the BoJ Summary of Opinions and Japan’s Current Account
From a daily chart perspective, the USD/JPY has dived inside the Ichimoku Cloud (Kumo), opening the door for further losses, which could be capped by the Kijun and Tenkan-Sen levels, at 141.15 and 140.97, respectively. A break below will send the pair sliding towards the bottom of the Kumo at 139.05, ahead of plunging to July 28 low of 138.05. Hence, if buyers do not enter the market, the USD/JPY could erase almost 2.39% of its hard-earned gains. Contrarily, USD/JPY buyers must reclaim the 142.00 figure to have a chance of regaining control. Up next would be the 143.00 figure.
Technical Levels: Supports and Resistances
USDJPY currently trading at 141.77 at the time of writing. Pair opened at 142.59 and is trading with a change of -0.58 % .
| Overview | Overview.1 | |
|---|---|---|
| 0 | Today last price | 141.77 |
| 1 | Today Daily Change | -0.82 |
| 2 | Today Daily Change % | -0.58 |
| 3 | Today daily open | 142.59 |
The pair remains strongly bullish on the daily timeframe. It trades above its 20 SMA @ 140.65, 50 SMA 141.26, 100 SMA @ 137.78 and 200 SMA @ 136.61.
| Trends | Trends.1 | |
|---|---|---|
| 0 | Daily SMA20 | 140.65 |
| 1 | Daily SMA50 | 141.26 |
| 2 | Daily SMA100 | 137.78 |
| 3 | Daily SMA200 | 136.61 |
The previous day high was 143.89 while the previous day low was 142.06. The daily 38.2% Fib levels comes at 142.76, expected to provide resistance. Similarly, the daily 61.8% fib level is at 143.19, expected to provide resistance.
Note the levels of interest below:
- Pivot support is noted at 141.81, 141.02, 139.98
- Pivot resistance is noted at 143.64, 144.68, 145.46
| Levels | Levels.1 |
|---|---|
| Previous Daily High | 143.89 |
| Previous Daily Low | 142.06 |
| Previous Weekly High | 141.82 |
| Previous Weekly Low | 138.07 |
| Previous Monthly High | 144.91 |
| Previous Monthly Low | 137.24 |
| Daily Fibonacci 38.2% | 142.76 |
| Daily Fibonacci 61.8% | 143.19 |
| Daily Pivot Point S1 | 141.81 |
| Daily Pivot Point S2 | 141.02 |
| Daily Pivot Point S3 | 139.98 |
| Daily Pivot Point R1 | 143.64 |
| Daily Pivot Point R2 | 144.68 |
| Daily Pivot Point R3 | 145.46 |
[/s2If]
Download Nehcap EAWe have two EAs that are operational on our LIVE accounts.
- EA-FIX: Check out the details here. Download EA-FIX . EA-FIX is a non-grid HFT scalper.
- EA-GROWTH: High quality low dd EA using trend grids. Download EA_GROWTHJoin Our Telegram Group


