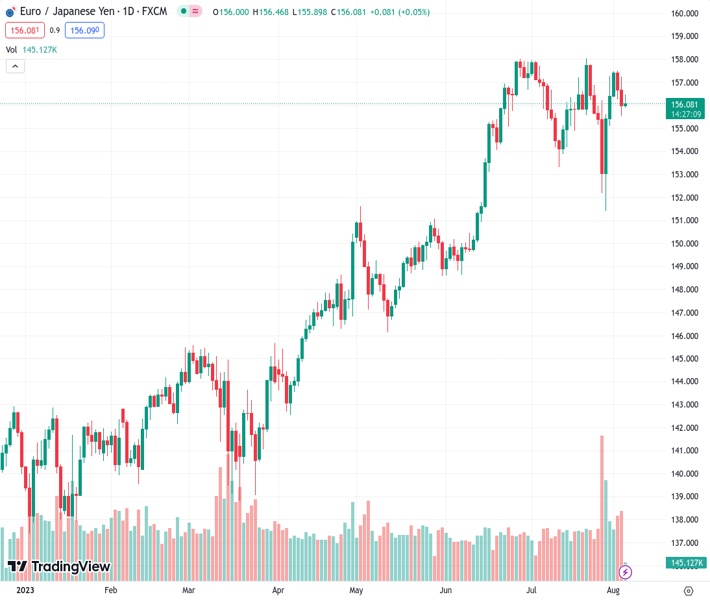
The EURJPY pair continues to face downward pressure with a consecutive two-day decline, and it currently lacks clear indications on its future direction.
…
This is a premium post.
[s2If !current_user_can(access_s2member_level4)]Please register for FREE REGISTER to read full post below containing analysis. In case of any error or you think you are not able to read the full post below, please email us at support#nehcap.com [lwa][/s2If] [s2If current_user_can(access_s2member_level1)]
- EUR/JPY stays pressured after two-day losing streak, lacks clear directions of late.
The pair currently trades last at 156.021.
The previous day high was 157.24 while the previous day low was 155.53. The daily 38.2% Fib levels comes at 156.18, expected to provide resistance. Similarly, the daily 61.8% fib level is at 156.59, expected to provide resistance.
EUR/JPY remains sidelined around 156.00 as it pays little heed to the German Factory Orders data amid early Friday morning in Europe. In doing so, the cross-currency pair struggles for clear directions amid downbeats yields and mixed concerns about the European Central Bank (ECB) and the Bank of Japan (BoJ).
Germany’s Factory Orders grew 3.0% YoY versus -4.4% prior while the monthly growth came out as 7.0% from 6.2% previous readings and -2.0% market forecasts.
That said, Thursday’s softer prints of the Eurozone Producer Price Index (PPI) for June, the lowest in three years, with -3.4% YoY figures versus -3.1% expected and -1.6% prior (revised), weighed on the EUR/JPY price the previous day. On the same line were the final readings of the bloc’s HCOB Composite PMI and Services PMI for July deteriorated while the same activity numbers for Germany improved from the initial forecasts for the said month.
Furthermore, the mixed comments from European Central Bank (ECB) board member Fabio Panetta also weighed on the pair as he supported high interest rates for a longer time via a webinar. The policymaker, however, also added, “Inflation risks are balanced and economic activity is weak.”
It should be noted that the Bank of Japan’s (BoJ) two unscheduled bond-buying programs and the decision-makers’ defense of the easy-money policy flags fears of the BoJ’s exit from the record low interest rate and/or a tweak to the Yield Curve Control (YCC) policy.
Elsewhere, top-tier Treasury bond yields retreat from the multi-month high marked the previous day and exert downside pressure on the EUR/JPY price, which in turn stops the quote from cheering the German data.
Looking forward, Eurozone Retail Sales for June, expected -1.7% YoY versus -2.9% prior, will be important to watch for intraday directions of the pair. Above all, the likely monetary policy divergence between the ECB and the BoJ keeps the EUR/JPY bears hopeful.
Bullish megaphone trend-widening formation keeps EUR/JPY buyers hopeful despite the latest U-turn from the pattern’s top line, close to 157.60 at the latest. That said, the 50-DMA level of 154.50 can restrict the immediate downside of the pair ahead of directing it to the stated megaphone’s bottom line of around 152.70.
Technical Levels: Supports and Resistances
EURJPY currently trading at 156.03 at the time of writing. Pair opened at 156.07 and is trading with a change of -0.03% % .
| Overview | Overview.1 | |
|---|---|---|
| 0 | Today last price | 156.03 |
| 1 | Today Daily Change | -0.04 |
| 2 | Today Daily Change % | -0.03% |
| 3 | Today daily open | 156.07 |
The pair remains strongly bullish on the daily timeframe. It trades above its 20 SMA @ 155.79, 50 SMA 154.4, 100 SMA @ 150.42 and 200 SMA @ 146.67.
| Trends | Trends.1 | |
|---|---|---|
| 0 | Daily SMA20 | 155.79 |
| 1 | Daily SMA50 | 154.40 |
| 2 | Daily SMA100 | 150.42 |
| 3 | Daily SMA200 | 146.67 |
The previous day high was 157.24 while the previous day low was 155.53. The daily 38.2% Fib levels comes at 156.18, expected to provide resistance. Similarly, the daily 61.8% fib level is at 156.59, expected to provide resistance.
Note the levels of interest below:
- Pivot support is noted at 155.32, 154.58, 153.62
- Pivot resistance is noted at 157.03, 157.99, 158.73
| Levels | Levels.1 |
|---|---|
| Previous Daily High | 157.24 |
| Previous Daily Low | 155.53 |
| Previous Weekly High | 157.80 |
| Previous Weekly Low | 151.41 |
| Previous Monthly High | 158.05 |
| Previous Monthly Low | 151.41 |
| Daily Fibonacci 38.2% | 156.18 |
| Daily Fibonacci 61.8% | 156.59 |
| Daily Pivot Point S1 | 155.32 |
| Daily Pivot Point S2 | 154.58 |
| Daily Pivot Point S3 | 153.62 |
| Daily Pivot Point R1 | 157.03 |
| Daily Pivot Point R2 | 157.99 |
| Daily Pivot Point R3 | 158.73 |
[/s2If]
Download Nehcap EAWe have two EAs that are operational on our LIVE accounts.
- EA-FIX: Check out the details here. Download EA-FIX . EA-FIX is a non-grid HFT scalper.
- EA-GROWTH: High quality low dd EA using trend grids. Download EA_GROWTHJoin Our Telegram Group


