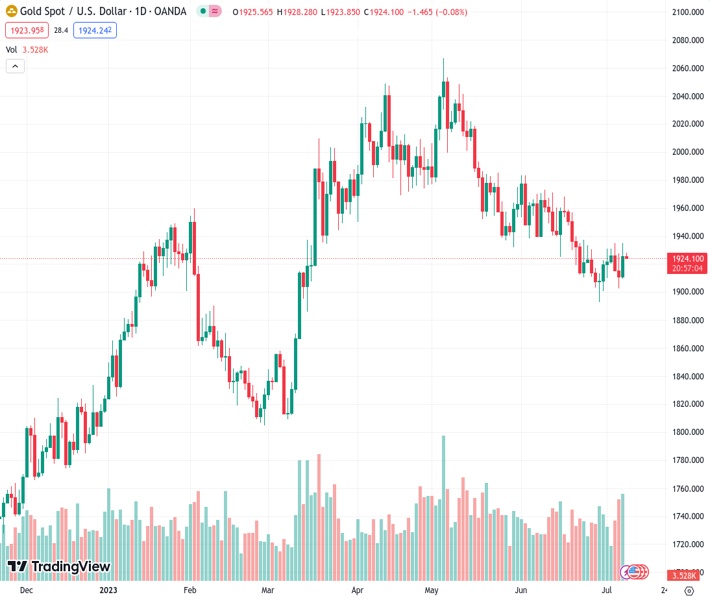
Gold’s price remains above $1,920 in the early Asian session, retaining its recent gains.
…
This is a premium post.
[s2If !current_user_can(access_s2member_level4)]Please register for FREE REGISTER to read full post below containing analysis. In case of any error or you think you are not able to read the full post below, please email us at support#nehcap.com [lwa][/s2If] [s2If current_user_can(access_s2member_level1)]
- Gold price holds recent gains above $1,920 in the early Asian session.
The pair currently trades last at 1924.99.
The previous day high was 1934.89 while the previous day low was 1909.69. The daily 38.2% Fib levels comes at 1925.26, expected to provide resistance. Similarly, the daily 61.8% fib level is at 1919.32, expected to provide support.
Gold price gains some traction and holds above $1,920 during an early Asian session on Monday. The weaker-than-expected US jobs data on Friday dragged the US dollar sharply lower across the board and benefited the Gold price.
The US economy added jobs at a slower-than-anticipated pace in June, as the Labor Department reported on Friday that Nonfarm Payrolls (NFP) rose by 209,000 last month, declining from a revised 306,000 in May. The market consensus expected the figure to increase by 225,000.
Meanwhile, the Unemployment Rate decreased from 3.7% to 3.6% in June and Average Hourly Earnings remained unchanged at 0.4%, above the market expectation of 0.3%.
Following the US labor data, the US 10-year Treasury bond yields fell to 4.023%. The US Dollar Index (DXY), a gauge of the dollar’s value against a basket of six currencies, slumped to 102.22 the lowest level since June 23. The US Treasury bond yield sell-off acted as a headwind for the US Dollar, benefiting the US Dollar-denominated Gold price.
Moving on, market players will now look for fresh cues from the Chinese CPI and Producer Price Index (PPI) data, which will feature later in the Asian session. Investors would then shift their focus toward the US Consumer Price Index (CPI), the Producer Price Index (PPI) and the US University of Michigan Preliminary Consumer Sentiment (July) later in the week. These data will determine the Gold price direction in the near term. The robust data could send US yields higher and weigh on Gold price. On the other hand, weak data could be positive for the precious metal.
From the technical perspective, Gold price stands at the upper band of a descending trend channel on a four-hour chart. The initial resistance level is seen at $1,935 (High of July 7), while $1,915 acts as an immediate support level for the time being.
Technical Levels: Supports and Resistances
XAUUSD currently trading at 1924.25 at the time of writing. Pair opened at 1925.0 and is trading with a change of -0.04 % .
| Overview | Overview.1 | |
|---|---|---|
| 0 | Today last price | 1924.25 |
| 1 | Today Daily Change | -0.76 |
| 2 | Today Daily Change % | -0.04 |
| 3 | Today daily open | 1925.00 |
The pair is trading below its 20 Daily moving average @ 1929.21, below its 50 Daily moving average @ 1961.99 , below its 100 Daily moving average @ 1947.99 and above its 200 Daily moving average @ 1866.34
| Trends | Trends.1 | |
|---|---|---|
| 0 | Daily SMA20 | 1929.21 |
| 1 | Daily SMA50 | 1961.99 |
| 2 | Daily SMA100 | 1947.99 |
| 3 | Daily SMA200 | 1866.34 |
The previous day high was 1934.89 while the previous day low was 1909.69. The daily 38.2% Fib levels comes at 1925.26, expected to provide resistance. Similarly, the daily 61.8% fib level is at 1919.32, expected to provide support.
Note the levels of interest below:
- Pivot support is noted at 1911.5, 1897.99, 1886.3
- Pivot resistance is noted at 1936.7, 1948.39, 1961.9
| Levels | Levels.1 |
|---|---|
| Previous Daily High | 1934.89 |
| Previous Daily Low | 1909.69 |
| Previous Weekly High | 1935.09 |
| Previous Weekly Low | 1902.77 |
| Previous Monthly High | 1983.50 |
| Previous Monthly Low | 1893.01 |
| Daily Fibonacci 38.2% | 1925.26 |
| Daily Fibonacci 61.8% | 1919.32 |
| Daily Pivot Point S1 | 1911.50 |
| Daily Pivot Point S2 | 1897.99 |
| Daily Pivot Point S3 | 1886.30 |
| Daily Pivot Point R1 | 1936.70 |
| Daily Pivot Point R2 | 1948.39 |
| Daily Pivot Point R3 | 1961.90 |
[/s2If]
Download Nehcap EAWe have two EAs that are operational on our LIVE accounts.
- EA-FIX: Check out the details here. Download EA-FIX . EA-FIX is a non-grid HFT scalper.
- EA-GROWTH: High quality low dd EA using trend grids. Download EA_GROWTHJoin Our Telegram Group
")


