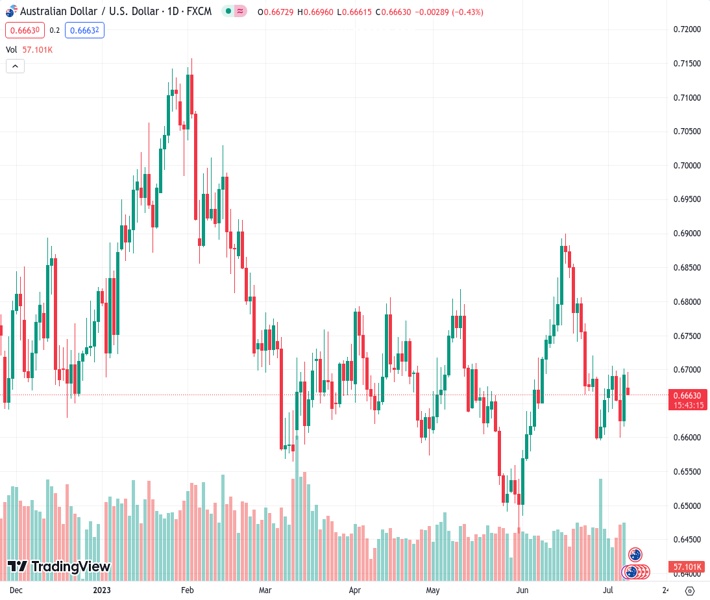
After facing significant selling pressure driven by China’s below-average inflation, the AUDUSD currency pair has managed to stabilize at a support level of 0.66640.
…
This is a premium post.
[s2If !current_user_can(access_s2member_level4)]Please register for FREE REGISTER to read full post below containing analysis. In case of any error or you think you are not able to read the full post below, please email us at support#nehcap.com [lwa][/s2If] [s2If current_user_can(access_s2member_level1)]
- AUD/USD has found support after sheer selling pressures inspired by weak inflation in China.
The pair currently trades last at 0.66640.
The previous day high was 0.6701 while the previous day low was 0.662. The daily 38.2% Fib levels comes at 0.667, expected to provide resistance. Similarly, the daily 61.8% fib level is at 0.6651, expected to provide support.
The AUD/USD pair has found intermediate support near the crucial support of 0.6660 in the Asian session. The Aussie asset is expected to continue its downside journey amid headwinds of a significantly low Consumer Price Index (CPI) in China and expectations that inflation in the United States will remain stubborn.
Monthly inflation in China for June remained stagnant vs. a figure of 0.2%. Annual CPI remained decelerated at 0.2%, similar to its prior release. Meanwhile, the annual Producer Price Index (PPI) has further decelerated to -5.4% vs. the former release of -4.6%. Lower factory-gate prices indicate that domestic and export demand is extremely vulnerable.
On the United States Dollar front, expectations have increased that inflation would further turn sticky as June wage numbers seem uncomfortable for the Federal Reserve (Fed) policymakers. Monthly economic data maintained a pace of 0.4% and remained higher than the consensus of 0.3%. Also, Annualized Average Hourly Earnings remained at a steady pace of 4.4%.
AUD/USD has faced stiff barricades near the downward-sloping trendline of the Descending Triangle chart pattern formed on a two-hour scale. The downward-sloping trendline of the aforementioned pattern is plotted from June 27 high at 0.6720 while the horizontal support is placed from June 29 low at 0.6595.
The 50-period Exponential Moving Average (EMA) at 0.6620 is providing some cushion to the Australian Dollar bulls.
Meanwhile, the Relative Strength Index (RSI) (14) is oscillating in the 40.00-60.00 range, portraying a non-directional performance.
A confident break June 29 low at 0.6595 would drag the asset toward June 02 low at 0.6565 and the round-level support at 0.6500.
On the flip side, a decisive break above July 04 high at 0.6705 would expose the asset to June 23 high at 0.6767, followed by the round-level resistance at 0.6800.
Technical Levels: Supports and Resistances
AUDUSD currently trading at 0.6666 at the time of writing. Pair opened at 0.6691 and is trading with a change of -0.37 % .
| Overview | Overview.1 | |
|---|---|---|
| 0 | Today last price | 0.6666 |
| 1 | Today Daily Change | -0.0025 |
| 2 | Today Daily Change % | -0.3700 |
| 3 | Today daily open | 0.6691 |
The pair remains strongly bearish on the daily time frame. It trades below the 20 SMA @ 0.6726, 50 SMA 0.6677, 100 SMA @ 0.6687 and 200 SMA @ 0.6697.
| Trends | Trends.1 | |
|---|---|---|
| 0 | Daily SMA20 | 0.6726 |
| 1 | Daily SMA50 | 0.6677 |
| 2 | Daily SMA100 | 0.6687 |
| 3 | Daily SMA200 | 0.6697 |
The previous day high was 0.6701 while the previous day low was 0.662. The daily 38.2% Fib levels comes at 0.667, expected to provide resistance. Similarly, the daily 61.8% fib level is at 0.6651, expected to provide support.
Note the levels of interest below:
- Pivot support is noted at 0.664, 0.6589, 0.6559
- Pivot resistance is noted at 0.6722, 0.6752, 0.6803
| Levels | Levels.1 |
|---|---|
| Previous Daily High | 0.6701 |
| Previous Daily Low | 0.6620 |
| Previous Weekly High | 0.6705 |
| Previous Weekly Low | 0.6599 |
| Previous Monthly High | 0.6900 |
| Previous Monthly Low | 0.6484 |
| Daily Fibonacci 38.2% | 0.6670 |
| Daily Fibonacci 61.8% | 0.6651 |
| Daily Pivot Point S1 | 0.6640 |
| Daily Pivot Point S2 | 0.6589 |
| Daily Pivot Point S3 | 0.6559 |
| Daily Pivot Point R1 | 0.6722 |
| Daily Pivot Point R2 | 0.6752 |
| Daily Pivot Point R3 | 0.6803 |
[/s2If]
Download Nehcap EAWe have two EAs that are operational on our LIVE accounts.
- EA-FIX: Check out the details here. Download EA-FIX . EA-FIX is a non-grid HFT scalper.
- EA-GROWTH: High quality low dd EA using trend grids. Download EA_GROWTHJoin Our Telegram Group
")


