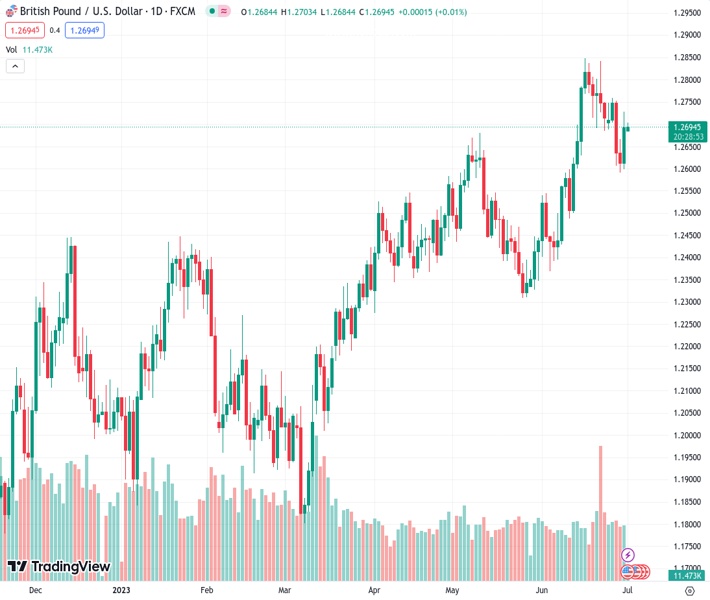
GBPUSD at 1.26958 remains in a state of relative inactivity after experiencing its largest increase in two weeks, along with consecutive quarterly increases.
…
This is a premium post.
[s2If !current_user_can(access_s2member_level4)]Please register for FREE REGISTER to read full post below containing analysis. In case of any error or you think you are not able to read the full post below, please email us at support#nehcap.com [lwa][/s2If] [s2If current_user_can(access_s2member_level1)]
- GBP/USD remains sidelined after rising the most in a fortnight, as well as rising in three consecutive quarters.
The pair currently trades last at 1.26958.
The previous day high was 1.2728 while the previous day low was 1.2599. The daily 38.2% Fib levels comes at 1.2679, expected to provide support. Similarly, the daily 61.8% fib level is at 1.2648, expected to provide support.
GBP/USD flirts with the 1.2700 round figure as bulls seek more clues to defend the previous day’s run-up amid a sluggish start to the key week. That said, the Cable pair’s recent inaction could also be linked to the mixed headlines about the UK’s employment and growth conditions, as well as a lack of clear market reaction to the news about the US-China talks.
The UK Times came out with the news suggesting British Health Secretary Steve Barclay’s willingness to give doctors a bigger pay rise, calling for an end to consultant strikes in order to resume negotiations. “Barclay’s admission came as the head of the NHS (National Health Services) warned that the disruption to routine healthcare would become “more significant” this month,” said the news. It should be noted that the UK’s employment report appeared mixed and signaled easing of the labor crunch.
Elsewhere, a senior US Treasury official, as well as China Treasury Department, both recently confirmed US Treasury Secretary Janet Yellen’s China visit during July 06-09 period. While the news appears positive for the sentiment on the front, the details seem less impressive as US Treasury Secretary Yellen is likely to flag concerns about human rights abuses against the Uyghur Muslim minority, China’s recent move to ban sales of Micron Technology memory chips, and moves by China against foreign due diligence and consulting firms, per Reuters.
It should be noted that Friday’s softer US inflation clues triggered the market’s risk-on mood and underpinned the GBP/USD pair’s run-up. Even so, the Cable pair dropped for the last two consecutive weeks amid fears of the UK recession. That said, the UK’s first quarter (Q1) 2023 GDP matches 0.1% QoQ and 0.2% YoY forecasts, per the latest readings.
On Friday, the Federal Reserve’s (Fed) preferred inflation gauge, namely the US Personal Consumption Expenditure (PCE) Price Index, poked hawkish expectations from the US central bank with the smallest yearly gain in six months. The same joined absence of any major hawkish comments from the US central bank officials, after a slew of Fed statements earlier in the last week, to favor the GBP/USD bulls.
Against this backdrop, S&P500 Futures grind higher by tracing upbeat Wall Street performance whereas the US Treasury bond yields remain firmer.
Moving on, the final readings of the UK’s S&P Global/CIPS Manufacturing PMI for June will precede the US ISM Manufacturing PMI for the said month to direct intraday moves of the GBP/USD pair. However, major attention will be given to this week’s Federal Open Market Committee (FOMC) Monetary policy meeting Minutes and the US jobs report.
A convergence of the fortnight-old descending resistance line and a 10-DMA challenges GBP/USD bulls around 1.2710.
Technical Levels: Supports and Resistances
GBPUSD currently trading at 1.2696 at the time of writing. Pair opened at 1.27 and is trading with a change of -0.03 % .
| Overview | Overview.1 | |
|---|---|---|
| 0 | Today last price | 1.2696 |
| 1 | Today Daily Change | -0.0004 |
| 2 | Today Daily Change % | -0.0300 |
| 3 | Today daily open | 1.2700 |
The pair remains strongly bullish on the daily timeframe. It trades above its 20 SMA @ 1.2652, 50 SMA 1.2549, 100 SMA @ 1.2379 and 200 SMA @ 1.2112.
| Trends | Trends.1 | |
|---|---|---|
| 0 | Daily SMA20 | 1.2652 |
| 1 | Daily SMA50 | 1.2549 |
| 2 | Daily SMA100 | 1.2379 |
| 3 | Daily SMA200 | 1.2112 |
The previous day high was 1.2728 while the previous day low was 1.2599. The daily 38.2% Fib levels comes at 1.2679, expected to provide support. Similarly, the daily 61.8% fib level is at 1.2648, expected to provide support.
Note the levels of interest below:
- Pivot support is noted at 1.2623, 1.2547, 1.2495
- Pivot resistance is noted at 1.2752, 1.2804, 1.2881
| Levels | Levels.1 |
|---|---|
| Previous Daily High | 1.2728 |
| Previous Daily Low | 1.2599 |
| Previous Weekly High | 1.2760 |
| Previous Weekly Low | 1.2591 |
| Previous Monthly High | 1.2848 |
| Previous Monthly Low | 1.2369 |
| Daily Fibonacci 38.2% | 1.2679 |
| Daily Fibonacci 61.8% | 1.2648 |
| Daily Pivot Point S1 | 1.2623 |
| Daily Pivot Point S2 | 1.2547 |
| Daily Pivot Point S3 | 1.2495 |
| Daily Pivot Point R1 | 1.2752 |
| Daily Pivot Point R2 | 1.2804 |
| Daily Pivot Point R3 | 1.2881 |
[/s2If]
Nehcap Expert Advisor
The NEHCAP MT4 EA is high quality professional trading system geared to generate returns without using GRID or martingales. Each trade has strict risk per trade parameter. The pairs under management include EURUSD, GBPUSD, AUDCAD, AUDNZD,GBPAUD, EURAUD, EURCAD, CHFJPY and many more.
The system is trading live: LIVE ACCOUNT TRACKING
You can run it free. Apply for a free trial and track our account. Buy the system or use profit share mechanism to generate returns on your MT4.
Join Our Telegram Group
")


