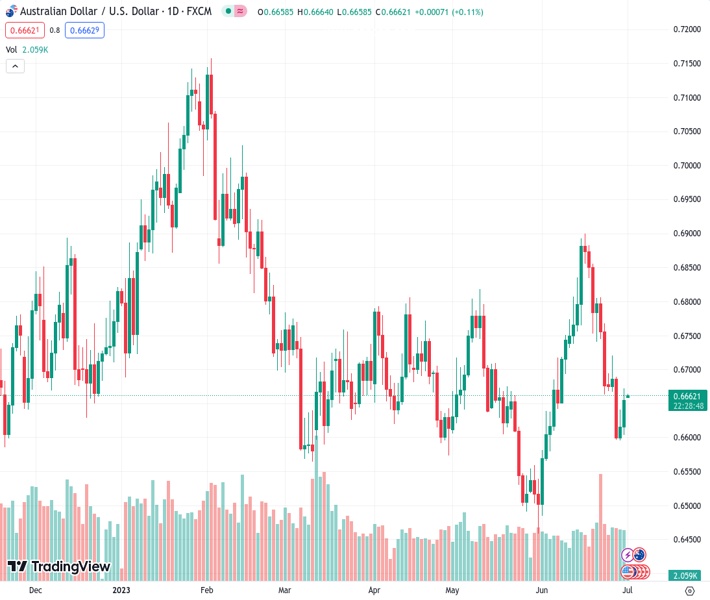
The AUDUSD pair is experiencing an upward trend at a rate of 0.66635 after two successive periods of losses in both the quarterly and monthly timeframes.
…
This is a premium post.
[s2If !current_user_can(access_s2member_level4)]Please register for FREE REGISTER to read full post below containing analysis. In case of any error or you think you are not able to read the full post below, please email us at support#nehcap.com [lwa][/s2If] [s2If current_user_can(access_s2member_level1)]
- AUD/USD grinds higher after two consecutive quarterly, monthly losses.
The pair currently trades last at 0.66635.
The previous day high was 0.6672 while the previous day low was 0.6603. The daily 38.2% Fib levels comes at 0.6646, expected to provide support. Similarly, the daily 61.8% fib level is at 0.6629, expected to provide support.
AUD/USD begins the key week with a cautious mood as it makes rounds to 0.6660 after Friday’s stellar run-up, following the two consecutive weekly, monthly and quarterly losses. In doing so, the Aussie pair aptly portrays the market’s anxiety ahead of Tuesday’s crucial Reserve Bank of Australia (RBA) Monetary Policy Meeting. Also important to watch is Wednesday’s Federal Open Market Committee (FOMC) Monetary policy meeting Minutes and Friday’s US jobs report, not to forget China’s Caixin Manufacturing PMI and the US ISM PMIs for June.
That said, the Aussie pair rallied the most in two weeks the previous day after the Federal Reserve’s (Fed) preferred inflation gauge prod hawkish expectations from the US central bank with the smallest yearly gain in six months.
US Personal Consumption Expenditure (PCE) Price Index, for May, came in at 0.3% MoM and 4.6% YoY versus market expectations of reprinting the 0.4% and 4.7% figures for monthly and yearly prior readings.
It should be noted that the downbeat US data bolstered equities and offered an additional upside boost to the risk-barometer pair.
Furthermore, hopes of China’s heavy investments to lift the world’s second-largest economy from losing the recovery momentum also allowed the Aussie pair to remain firmer.
Alternatively, Fed Chair Jerome Powell’s support for “two more rate hikes in 2023” joined downbeat Aussie inflation numbers and PMIs to flag the RBA’s halt in rate hikes to weigh on the AUD/USD price.
Above all, the market’s lack of growth optimism joins the fears of the RBA’s no rate hike, versus the Fed’s another rate increase, to challenge the AUD/USD pair. However, Tuesday’s RBA Interest Rate decision will be crucial to watch as the Australian central bank surprised markets with a rate increase in the last two consecutive meetings.
For today, China’s Caixin Manufacturing PMI for June, expected 50.2 versus 50.9 prior, will precede the US ISM Manufacturing PMI for the said month, likely to improve to 47.2 from 46.9 previous readings, to direct the AUD/USD pair ahead of Tuesday’s RBA meeting.
A clear upside break of a fortnight-old descending resistance line directs AUD/USD towards a convergence of the 200-DMA and the 100-DMA, near the 0.6700 round figure by the press time.
Technical Levels: Supports and Resistances
AUDUSD currently trading at 0.6663 at the time of writing. Pair opened at 0.6665 and is trading with a change of -0.03% % .
| Overview | Overview.1 | |
|---|---|---|
| 0 | Today last price | 0.6663 |
| 1 | Today Daily Change | -0.0002 |
| 2 | Today Daily Change % | -0.03% |
| 3 | Today daily open | 0.6665 |
The pair remains strongly bearish on the daily time frame. It trades below the 20 SMA @ 0.6729, 50 SMA 0.6674, 100 SMA @ 0.67 and 200 SMA @ 0.6692.
| Trends | Trends.1 | |
|---|---|---|
| 0 | Daily SMA20 | 0.6729 |
| 1 | Daily SMA50 | 0.6674 |
| 2 | Daily SMA100 | 0.6700 |
| 3 | Daily SMA200 | 0.6692 |
The previous day high was 0.6672 while the previous day low was 0.6603. The daily 38.2% Fib levels comes at 0.6646, expected to provide support. Similarly, the daily 61.8% fib level is at 0.6629, expected to provide support.
Note the levels of interest below:
- Pivot support is noted at 0.6622, 0.6578, 0.6553
- Pivot resistance is noted at 0.669, 0.6715, 0.6758
| Levels | Levels.1 |
|---|---|
| Previous Daily High | 0.6672 |
| Previous Daily Low | 0.6603 |
| Previous Weekly High | 0.6721 |
| Previous Weekly Low | 0.6595 |
| Previous Monthly High | 0.6900 |
| Previous Monthly Low | 0.6484 |
| Daily Fibonacci 38.2% | 0.6646 |
| Daily Fibonacci 61.8% | 0.6629 |
| Daily Pivot Point S1 | 0.6622 |
| Daily Pivot Point S2 | 0.6578 |
| Daily Pivot Point S3 | 0.6553 |
| Daily Pivot Point R1 | 0.6690 |
| Daily Pivot Point R2 | 0.6715 |
| Daily Pivot Point R3 | 0.6758 |
[/s2If]
Nehcap Expert Advisor
The NEHCAP MT4 EA is high quality professional trading system geared to generate returns without using GRID or martingales. Each trade has strict risk per trade parameter. The pairs under management include EURUSD, GBPUSD, AUDCAD, AUDNZD,GBPAUD, EURAUD, EURCAD, CHFJPY and many more.
The system is trading live: LIVE ACCOUNT TRACKING
You can run it free. Apply for a free trial and track our account. Buy the system or use profit share mechanism to generate returns on your MT4.
Join Our Telegram Group
")


