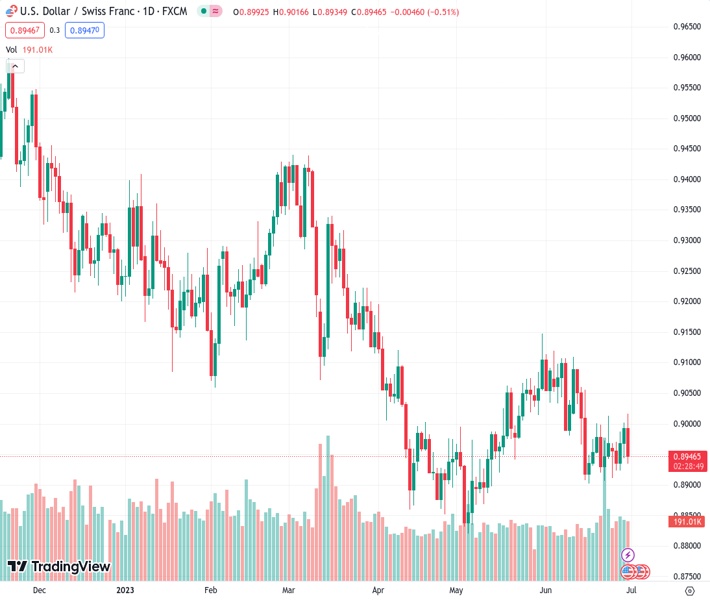
The USDCHF pair, currently priced at 0.89457, has fallen below the important level of 0.90. The decline continues as sellers are looking to reach the 0.8900 mark.
…
This is a premium post.
[s2If !current_user_can(access_s2member_level4)]Please register for FREE REGISTER to read full post below containing analysis. In case of any error or you think you are not able to read the full post below, please email us at support#nehcap.com [lwa][/s2If] [s2If current_user_can(access_s2member_level1)]
- USD/CHF drops below key 0.90 level, extending losses as sellers eye a test of the 0.8900 mark.
The pair currently trades last at 0.89457.
The previous day high was 0.9002 while the previous day low was 0.8944. The daily 38.2% Fib levels comes at 0.898, expected to provide resistance. Similarly, the daily 61.8% fib level is at 0.8966, expected to provide resistance.
USD/CHF fails to decisively crack the 50-day Exponential Moving Average (EMA) at 0.9007, drops beneath the 0.90 figure, and extends its losses below technical support levels, as sellers see a test of the 0.8900 mark. At the time of writing, the USD/CHF trades at 0.8947, down 0.51%.
The USD/CHF is neutral to downward biased, as price action remains constrained within the 0.89/0.90 area for the last two trading weeks. The Relative Strength Index (RSI) indicator portrays sellers in charge, but it should be said the RSI has printed higher throughs, suggesting selling pressure is fading. In the meantime, the three-day Rate of Change (RoC) remains positive despite the USD/CHF is printing losses.
If USD/CHF continues to edge lower, the first support would be 0.8900. A breach of the latter will expose the year-to-date (YTD) low of 0.8819. Conversely, if buyers reclaim the 20-day EXMA at 0.8979, that will expose the 50-day EMA at 0.9007. Once cleared, the next resistance would be the 100-day EMA at 0.9080 before challenging the 0.9100 mark.
Technical Levels: Supports and Resistances
USDCHF currently trading at 0.8947 at the time of writing. Pair opened at 0.8994 and is trading with a change of -0.52 % .
| Overview | Overview.1 | |
|---|---|---|
| 0 | Today last price | 0.8947 |
| 1 | Today Daily Change | -0.0047 |
| 2 | Today Daily Change % | -0.5200 |
| 3 | Today daily open | 0.8994 |
The pair remains strongly bearish on the daily time frame. It trades below the 20 SMA @ 0.9001, 50 SMA 0.898, 100 SMA @ 0.9088 and 200 SMA @ 0.9309.
| Trends | Trends.1 | |
|---|---|---|
| 0 | Daily SMA20 | 0.9001 |
| 1 | Daily SMA50 | 0.8980 |
| 2 | Daily SMA100 | 0.9088 |
| 3 | Daily SMA200 | 0.9309 |
The previous day high was 0.9002 while the previous day low was 0.8944. The daily 38.2% Fib levels comes at 0.898, expected to provide resistance. Similarly, the daily 61.8% fib level is at 0.8966, expected to provide resistance.
Note the levels of interest below:
- Pivot support is noted at 0.8957, 0.8921, 0.8899
- Pivot resistance is noted at 0.9016, 0.9038, 0.9074
| Levels | Levels.1 |
|---|---|
| Previous Daily High | 0.9002 |
| Previous Daily Low | 0.8944 |
| Previous Weekly High | 0.9013 |
| Previous Weekly Low | 0.8907 |
| Previous Monthly High | 0.9148 |
| Previous Monthly Low | 0.8820 |
| Daily Fibonacci 38.2% | 0.8980 |
| Daily Fibonacci 61.8% | 0.8966 |
| Daily Pivot Point S1 | 0.8957 |
| Daily Pivot Point S2 | 0.8921 |
| Daily Pivot Point S3 | 0.8899 |
| Daily Pivot Point R1 | 0.9016 |
| Daily Pivot Point R2 | 0.9038 |
| Daily Pivot Point R3 | 0.9074 |
[/s2If]
Nehcap Expert Advisor
The NEHCAP MT4 EA is high quality professional trading system geared to generate returns without using GRID or martingales. Each trade has strict risk per trade parameter. The pairs under management include EURUSD, GBPUSD, AUDCAD, AUDNZD,GBPAUD, EURAUD, EURCAD, CHFJPY and many more.
The system is trading live: LIVE ACCOUNT TRACKING
You can run it free. Apply for a free trial and track our account. Buy the system or use profit share mechanism to generate returns on your MT4.
Join Our Telegram Group
")


