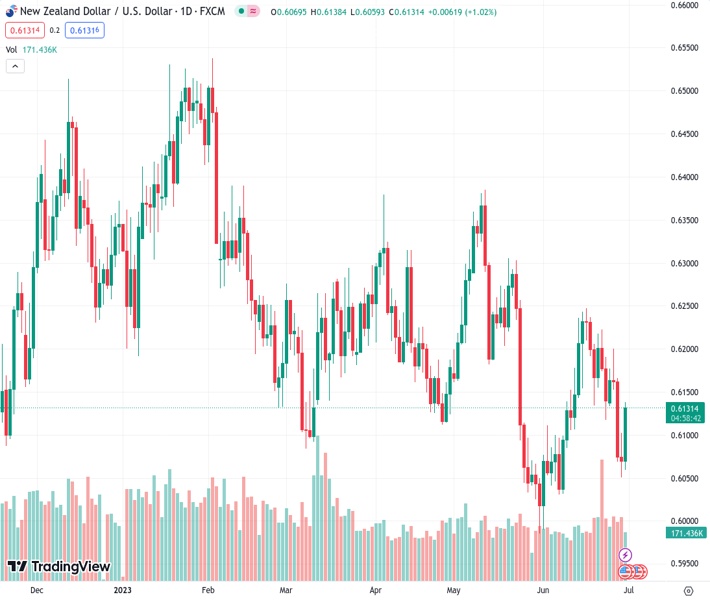
The NZDUSD pair, currently at 0.61302, has recovered some of its losses from the previous day and rose to 0.6130, representing a 0.90% increase for the day.
…
This is a premium post.
[s2If !current_user_can(access_s2member_level4)]Please register for FREE REGISTER to read full post below containing analysis. In case of any error or you think you are not able to read the full post below, please email us at support#nehcap.com [lwa][/s2If] [s2If current_user_can(access_s2member_level1)]
- NZD/USD cleared part of it previous day’s losses and climbed to 0.6130, 0.90% up on the day.
The pair currently trades last at 0.61302.
The previous day high was 0.6112 while the previous day low was 0.605. The daily 38.2% Fib levels comes at 0.6074, expected to provide support. Similarly, the daily 61.8% fib level is at 0.6088, expected to provide support.
On Friday, following the release of soft Personal Consumption Expenditures (PCE) data from the US, the NZD/USD pair staged a recovery, erasing a portion of its previous day’s losses. The pair advanced to 0.6120, marking an increase of 0.80% for the day. Following the data, US bond yields retreated, weakening the US Dollar, but remained in positive territory.
On Friday, the US Bureau of Economic Analysis reported that the Core PCE, the Federal Reserve’s (Fed) preferred gauge of inflation from May from the US, slightly decelerated. The figure declined to 4.6% YoY from its previous 4.7% reading, failing to meet the expectations of 4.7% and tallying a 0.3% MoM increase vs the 0.4% expected.
As a reaction, US bond yields retreated from daily highs as investors seemed to be betting on a less aggressive Fed. In that sense, the 2-year bond yield peaked at 4.93%, its highest level since March 9, retreating to 4.85%, while the 5 and 10-year rates fell to 4.13% and 3.83%.
However, more evidence of inflation deceleration must be seen for the Fed to pivot from its hawkish stance. As for now, according to the CME FedWatch tool market is almost completely discounting a 25 basis points (bps) hike on July 31 and still trying to figure out when the second hike Jerome Powell hinted will come.
According to the daily chart, the technical outlook for the NZD/USD got better as the Relative Strength (RSI) and Moving Average Convergence Divergence (MACD) gained traction in negative territory. In addition, traders should eye the convergence of the 200 and 20-day Simple Moving Averages (SMA). Moreover, traders should eye the 200,100 and 20-day Simple Moving Averages (SMA) convergence towards the 0.6140-0.6200 area as they seem to be about to perform a bearish cross.
On the downside, support levels to watch align at 0.6100,0.6050 and at 0.6030 (strong support seen at the beginning of June).
.
Technical Levels: Supports and Resistances
NZDUSD currently trading at 0.6129 at the time of writing. Pair opened at 0.607 and is trading with a change of 0.97 % .
| Overview | Overview.1 | |
|---|---|---|
| 0 | Today last price | 0.6129 |
| 1 | Today Daily Change | 0.0059 |
| 2 | Today Daily Change % | 0.9700 |
| 3 | Today daily open | 0.6070 |
The pair remains strongly bearish on the daily time frame. It trades below the 20 SMA @ 0.6138, 50 SMA 0.6167, 100 SMA @ 0.6197 and 200 SMA @ 0.616.
| Trends | Trends.1 | |
|---|---|---|
| 0 | Daily SMA20 | 0.6138 |
| 1 | Daily SMA50 | 0.6167 |
| 2 | Daily SMA100 | 0.6197 |
| 3 | Daily SMA200 | 0.6160 |
The previous day high was 0.6112 while the previous day low was 0.605. The daily 38.2% Fib levels comes at 0.6074, expected to provide support. Similarly, the daily 61.8% fib level is at 0.6088, expected to provide support.
Note the levels of interest below:
- Pivot support is noted at 0.6043, 0.6015, 0.5981
- Pivot resistance is noted at 0.6105, 0.6139, 0.6167
| Levels | Levels.1 |
|---|---|
| Previous Daily High | 0.6112 |
| Previous Daily Low | 0.6050 |
| Previous Weekly High | 0.6237 |
| Previous Weekly Low | 0.6116 |
| Previous Monthly High | 0.6385 |
| Previous Monthly Low | 0.5985 |
| Daily Fibonacci 38.2% | 0.6074 |
| Daily Fibonacci 61.8% | 0.6088 |
| Daily Pivot Point S1 | 0.6043 |
| Daily Pivot Point S2 | 0.6015 |
| Daily Pivot Point S3 | 0.5981 |
| Daily Pivot Point R1 | 0.6105 |
| Daily Pivot Point R2 | 0.6139 |
| Daily Pivot Point R3 | 0.6167 |
[/s2If]
Nehcap Expert Advisor
The NEHCAP MT4 EA is high quality professional trading system geared to generate returns without using GRID or martingales. Each trade has strict risk per trade parameter. The pairs under management include EURUSD, GBPUSD, AUDCAD, AUDNZD,GBPAUD, EURAUD, EURCAD, CHFJPY and many more.
The system is trading live: LIVE ACCOUNT TRACKING
You can run it free. Apply for a free trial and track our account. Buy the system or use profit share mechanism to generate returns on your MT4.
Join Our Telegram Group
")


