The GBPJPY pair recovered after experiencing losses over the past two days, and is now ready for its seventh straight week of gains.
…
This is a premium post.
[s2If !current_user_can(access_s2member_level4)]Please register for FREE REGISTER to read full post below containing analysis. In case of any error or you think you are not able to read the full post below, please email us at support#nehcap.com [lwa][/s2If] [s2If current_user_can(access_s2member_level1)]
- The GBP/JPY cross regained ground after two days of losses, poised for the seventh consecutive weekly gain.
The pair currently trades last at 183.237.
The previous day high was 182.88 while the previous day low was 182.22. The daily 38.2% Fib levels comes at 182.63, expected to provide support. Similarly, the daily 61.8% fib level is at 182.47, expected to provide support.
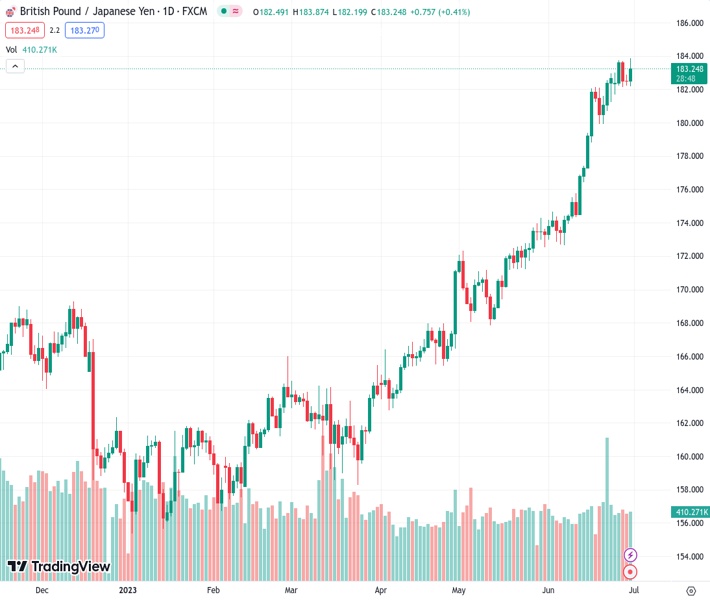
The GBP/JPY jumped to a high of 183.87 level and then stabilized at 183.25, after experiencing two consecutive days of losses – though still on track for its seventh consecutive weekly gain. The revised British Q1 GDP figures revealed no surprises, with a year-on-year growth rate of 0.2%. On the other hand, Japanese inflation data for May unexpectedly showed a deceleration, thereby continuing to support a dovish stance by the Bank of Japan (BoJ).
On Friday, the National Statistics Office of the UK, confirmed that the GDP from the UK in Q1 expanded at an annualized rate of 0.2%, just as expected. It’s worth noting that Andrew Bailey from the Bank of England (BoE), stated on Wednesday that he expects economic activity “to flatten” but that the bank will do whatever is necessary to bring inflation down. As a result of his comments, in the previous days Sterling had faced some selling pressure as traders worried about the impact of the aggressive stance of the BoE on economic activity. Friday’s GDP figures, however, brought some calm to markets.
In contrast, the Tokyo Consumer Price Index (CPI) for June displayed a lower-than-expected headline figure of 3.1% year-on-year, compared to the anticipated 3.8%. The Core CPI figure reached 3.8% (previously projected at 4.1%). The results aligned with comments made by Governor Kazuo Ueda of the Bank of Japan (BoJ) during his Wednesday statement, when he emphasized that once inflation aligns with the Bank’s forecast, he will consider a potential policy shift. The declining inflationary pressure in Japan, however, supports a more dovish stance, consequently, a less attractive Yen.
According to the daily chart, the GBP/JPY’s positive trajectory is intact, but the cross remains overbought, suggesting a need to consolidate gains. The Relative Strength Index (RSI) holds a positive slope above 70. At the same time, the Moving Average Convergence Divergence (MACD) prints decreasing green bars suggesting that the bullish momentum is slowly fading and possibly suggesting that a correction may be on the horizon.
On the downside, support levels line up at 183.00, followed by the 182.30 zone and the 181.00 psychological mark. On the flip side, in case of gaining more ground, the cross will face resistances at 183.70, 184.00 and 184.50.
Technical Levels: Supports and Resistances
GBPJPY currently trading at 183.25 at the time of writing. Pair opened at 182.6 and is trading with a change of 0.36 % .
| Overview | Overview.1 | |
|---|---|---|
| 0 | Today last price | 183.25 |
| 1 | Today Daily Change | 0.65 |
| 2 | Today Daily Change % | 0.36 |
| 3 | Today daily open | 182.60 |
The pair remains strongly bullish on the daily timeframe. It trades above its 20 SMA @ 178.77, 50 SMA 173.87, 100 SMA @ 168.48 and 200 SMA @ 165.95.
| Trends | Trends.1 | |
|---|---|---|
| 0 | Daily SMA20 | 178.77 |
| 1 | Daily SMA50 | 173.87 |
| 2 | Daily SMA100 | 168.48 |
| 3 | Daily SMA200 | 165.95 |
The previous day high was 182.88 while the previous day low was 182.22. The daily 38.2% Fib levels comes at 182.63, expected to provide support. Similarly, the daily 61.8% fib level is at 182.47, expected to provide support.
Note the levels of interest below:
- Pivot support is noted at 182.26, 181.91, 181.59
- Pivot resistance is noted at 182.92, 183.23, 183.58
| Levels | Levels.1 |
|---|---|
| Previous Daily High | 182.88 |
| Previous Daily Low | 182.22 |
| Previous Weekly High | 182.95 |
| Previous Weekly Low | 179.92 |
| Previous Monthly High | 174.28 |
| Previous Monthly Low | 167.84 |
| Daily Fibonacci 38.2% | 182.63 |
| Daily Fibonacci 61.8% | 182.47 |
| Daily Pivot Point S1 | 182.26 |
| Daily Pivot Point S2 | 181.91 |
| Daily Pivot Point S3 | 181.59 |
| Daily Pivot Point R1 | 182.92 |
| Daily Pivot Point R2 | 183.23 |
| Daily Pivot Point R3 | 183.58 |
[/s2If]
Nehcap Expert Advisor
The NEHCAP MT4 EA is high quality professional trading system geared to generate returns without using GRID or martingales. Each trade has strict risk per trade parameter. The pairs under management include EURUSD, GBPUSD, AUDCAD, AUDNZD,GBPAUD, EURAUD, EURCAD, CHFJPY and many more.
The system is trading live: LIVE ACCOUNT TRACKING
You can run it free. Apply for a free trial and track our account. Buy the system or use profit share mechanism to generate returns on your MT4.
Join Our Telegram Group
")


