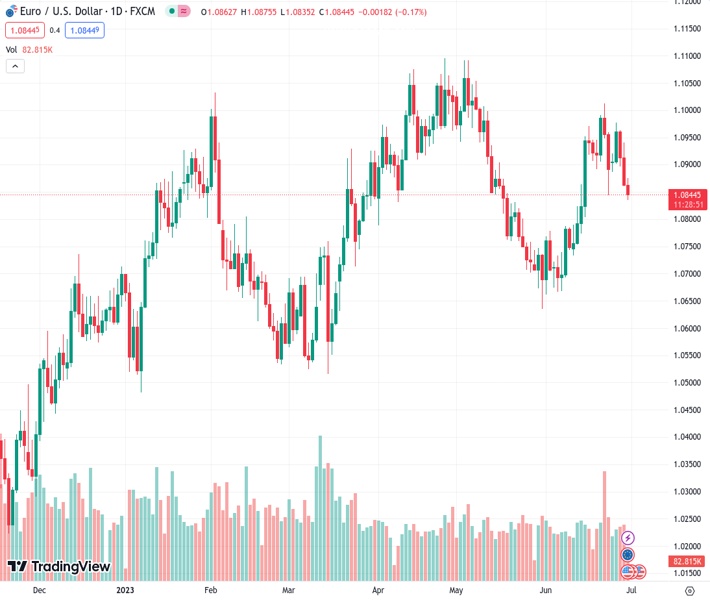
The EURUSD pair, currently at 1.08445, continues to decline for the third consecutive day, reaching a low point not seen in over two weeks on Friday.
…
This is a premium post.
[s2If !current_user_can(access_s2member_level4)]Please register for FREE REGISTER to read full post below containing analysis. In case of any error or you think you are not able to read the full post below, please email us at support#nehcap.com [lwa][/s2If] [s2If current_user_can(access_s2member_level1)]
- EUR/USD drifts lower for the third straight day and drops to over a two-week low on Friday.
The pair currently trades last at 1.08445.
The previous day high was 1.0941 while the previous day low was 1.086. The daily 38.2% Fib levels comes at 1.0891, expected to provide resistance. Similarly, the daily 61.8% fib level is at 1.091, expected to provide resistance.
The EUR/USD pair attracts fresh sellers following a modest intraday uptick to the 1.0875 region on Friday and turns lower for the third successive day. Spot prices drop to over a two-week low following the release of the Euro Zone consumer inflation figures and trade around the 1.0840-1.0835 region during the early part of the European session.
The preliminary report published by Eurostat showed that the annual Euro Zone Harmonised Index of Consumer Prices (HICP) climbed 0.3% in June as compared to a flat reading anticipated. This, however, was offset by a sharp deceleration in the yearly rate to 5.5% from 6.1% in the previous month. Adding to this, the Core HICP rose by 0.3% MoM and edged higher to 5.4% on a yearly basis, missing consensus estimates. The data reaffirms bets for another 25 bps lift-off by the European Central Bank (ECB) in July, albeit fails to impress the Euro bulls or lend any support to the EUR/USD pair in the wake of worries about economic headwinds stemming from rising borrowing costs.
The US Dollar (USD), on the other hand, hits a fresh three-week high and remains supported by the Federal Reserve’s (Fed) hawkish outlook, signalling that interest rates may still need to rise as much as 50 bps by the end of this year. The outlook was reinforced by the upbeat US macro data released on Thursday and Fed Chair Jerome Powell’s hawkish remarks earlier this week. This, in turn, continues to push the US Treasury bond yields higher, which, in turn, underpins the USD and further contributes to the offered tone surrounding the EUR/USD pair.
With the latest leg down, spot prices have dropped nearly 150 pips from the weekly high touched on Tuesday and moved back closer to the 100-day Simple Moving Average (SMA). Any further decline, however, seems limited as traders now seem to wait on the sidelines ahead of the release of the US Core PCE Price Index – the Fed’s preferred inflation gauge – due later during the early North American session. The crucial data should influence the USD price dynamics and provide some meaningful impetus to the EUR/USD pair on the last day of the week.
Technical Levels: Supports and Resistances
EURUSD currently trading at 1.0841 at the time of writing. Pair opened at 1.0868 and is trading with a change of -0.25 % .
| Overview | Overview.1 | |
|---|---|---|
| 0 | Today last price | 1.0841 |
| 1 | Today Daily Change | -0.0027 |
| 2 | Today Daily Change % | -0.2500 |
| 3 | Today daily open | 1.0868 |
The pair is trading below its 20 Daily moving average @ 1.0847, below its 50 Daily moving average @ 1.0873 , above its 100 Daily moving average @ 1.0817 and above its 200 Daily moving average @ 1.0585
| Trends | Trends.1 | |
|---|---|---|
| 0 | Daily SMA20 | 1.0847 |
| 1 | Daily SMA50 | 1.0873 |
| 2 | Daily SMA100 | 1.0817 |
| 3 | Daily SMA200 | 1.0585 |
The previous day high was 1.0941 while the previous day low was 1.086. The daily 38.2% Fib levels comes at 1.0891, expected to provide resistance. Similarly, the daily 61.8% fib level is at 1.091, expected to provide resistance.
Note the levels of interest below:
- Pivot support is noted at 1.0839, 1.0809, 1.0758
- Pivot resistance is noted at 1.092, 1.0971, 1.1001
| Levels | Levels.1 |
|---|---|
| Previous Daily High | 1.0941 |
| Previous Daily Low | 1.0860 |
| Previous Weekly High | 1.1012 |
| Previous Weekly Low | 1.0844 |
| Previous Monthly High | 1.1092 |
| Previous Monthly Low | 1.0635 |
| Daily Fibonacci 38.2% | 1.0891 |
| Daily Fibonacci 61.8% | 1.0910 |
| Daily Pivot Point S1 | 1.0839 |
| Daily Pivot Point S2 | 1.0809 |
| Daily Pivot Point S3 | 1.0758 |
| Daily Pivot Point R1 | 1.0920 |
| Daily Pivot Point R2 | 1.0971 |
| Daily Pivot Point R3 | 1.1001 |
[/s2If]
Nehcap Expert Advisor
The NEHCAP MT4 EA is high quality professional trading system geared to generate returns without using GRID or martingales. Each trade has strict risk per trade parameter. The pairs under management include EURUSD, GBPUSD, AUDCAD, AUDNZD,GBPAUD, EURAUD, EURCAD, CHFJPY and many more.
The system is trading live: LIVE ACCOUNT TRACKING
You can run it free. Apply for a free trial and track our account. Buy the system or use profit share mechanism to generate returns on your MT4.
Join Our Telegram Group
")


