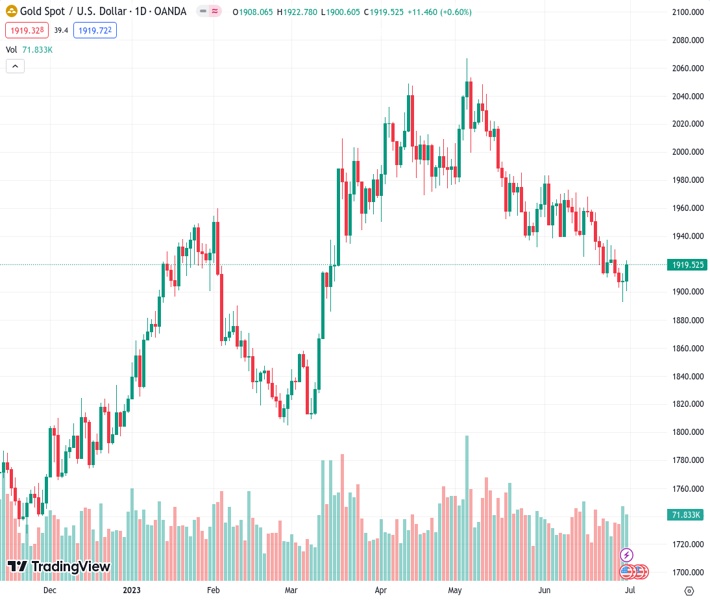
Even though the XAUUSD has been making gains on a daily basis, it is likely to end the week with a loss, close to the $1,920 range, marking its third week in a row with declining values.
…
This is a premium post.
[s2If !current_user_can(access_s2member_level4)]Please register for FREE REGISTER to read full post below containing analysis. In case of any error or you think you are not able to read the full post below, please email us at support#nehcap.com [lwa][/s2If] [s2If current_user_can(access_s2member_level1)]
- Despite daily gains, the XAU/USD is set to close a third consecutive week of losses, near the $1,920 area.
The pair currently trades last at 1919.57.
The previous day high was 1913.17 while the previous day low was 1893.01. The daily 38.2% Fib levels comes at 1905.47, expected to provide support. Similarly, the daily 61.8% fib level is at 1900.71, expected to provide support.
On Friday, the gold spot XAU/USD traded with nearly 0.50% gains, jumping near the $1,920 area. Soft Personal Consumer Expenditures from the US fueled a decline in US yields and, thereby, a weaker US Dollar, which boosted the yellow metal. Moreover, the Gold’s short-term trajectory will be determined by bets on the next Federal Reserve (Fed) decision, which will have an impact with crucial labour market data to be released next week.
After the US Bureau of Economic Analysis showed the Core Personal Consumption Expenditures (PCE), the Federal Reserve’s preferred measure of inflation, unexpectedly decelerated to 4.6% YoY in May. As attention now shifts to labour market data, Investors are trying to decipher the next moves by the Fed after Chair Powell commented that Federal Open Market Committee (FOMC) foresee additional hikes, driven by a hot labour market.
In that sense, Non-farm payrolls (NFP) are expected to decline to 200K in June. In addition, Average Hourly Earnings are foreseeing remaining steady at 4.3% YoY and the Unemployment rate at 3.7%.
As for now, markets are discounting 25 basis points (bps) hike in the next Fed meeting in July but disagree when the second hike Jerome Powell hinted will come. Is worth noticing that non-yielding yellow metals tend to be negatively correlated with interest rates so hawkish bets on the Fed would apply further selling pressure.
The technical outlook, according to the daily chart, for the XAU/USD remains neutral to bearish for the short term. The Relative Strength Index (RSI) holds below its midline but with a positive slope, while the Moving Average Convergence Divergence (MACD) prints rising red bars.
Support levels to watch: $1,905, $1,900, $1,890.
Resistances levels to watch: $1,930, $1,938 (20-day Simple Moving Average), $1,945 (100-day Simple Moving Average)
Technical Levels: Supports and Resistances
XAUUSD currently trading at 1920.08 at the time of writing. Pair opened at 1908.2 and is trading with a change of 0.62 % .
| Overview | Overview.1 | |
|---|---|---|
| 0 | Today last price | 1920.08 |
| 1 | Today Daily Change | 11.88 |
| 2 | Today Daily Change % | 0.62 |
| 3 | Today daily open | 1908.20 |
The pair is trading below its 20 Daily moving average @ 1940.32, below its 50 Daily moving average @ 1970.36 , below its 100 Daily moving average @ 1943.91 and above its 200 Daily moving average @ 1858.19
| Trends | Trends.1 | |
|---|---|---|
| 0 | Daily SMA20 | 1940.32 |
| 1 | Daily SMA50 | 1970.36 |
| 2 | Daily SMA100 | 1943.91 |
| 3 | Daily SMA200 | 1858.19 |
The previous day high was 1913.17 while the previous day low was 1893.01. The daily 38.2% Fib levels comes at 1905.47, expected to provide support. Similarly, the daily 61.8% fib level is at 1900.71, expected to provide support.
Note the levels of interest below:
- Pivot support is noted at 1896.42, 1884.63, 1876.26
- Pivot resistance is noted at 1916.58, 1924.95, 1936.74
| Levels | Levels.1 |
|---|---|
| Previous Daily High | 1913.17 |
| Previous Daily Low | 1893.01 |
| Previous Weekly High | 1958.85 |
| Previous Weekly Low | 1910.18 |
| Previous Monthly High | 2079.76 |
| Previous Monthly Low | 1932.12 |
| Daily Fibonacci 38.2% | 1905.47 |
| Daily Fibonacci 61.8% | 1900.71 |
| Daily Pivot Point S1 | 1896.42 |
| Daily Pivot Point S2 | 1884.63 |
| Daily Pivot Point S3 | 1876.26 |
| Daily Pivot Point R1 | 1916.58 |
| Daily Pivot Point R2 | 1924.95 |
| Daily Pivot Point R3 | 1936.74 |
[/s2If]
Nehcap Expert Advisor
The NEHCAP MT4 EA is high quality professional trading system geared to generate returns without using GRID or martingales. Each trade has strict risk per trade parameter. The pairs under management include EURUSD, GBPUSD, AUDCAD, AUDNZD,GBPAUD, EURAUD, EURCAD, CHFJPY and many more.
The system is trading live: LIVE ACCOUNT TRACKING
You can run it free. Apply for a free trial and track our account. Buy the system or use profit share mechanism to generate returns on your MT4.
Join Our Telegram Group
")


