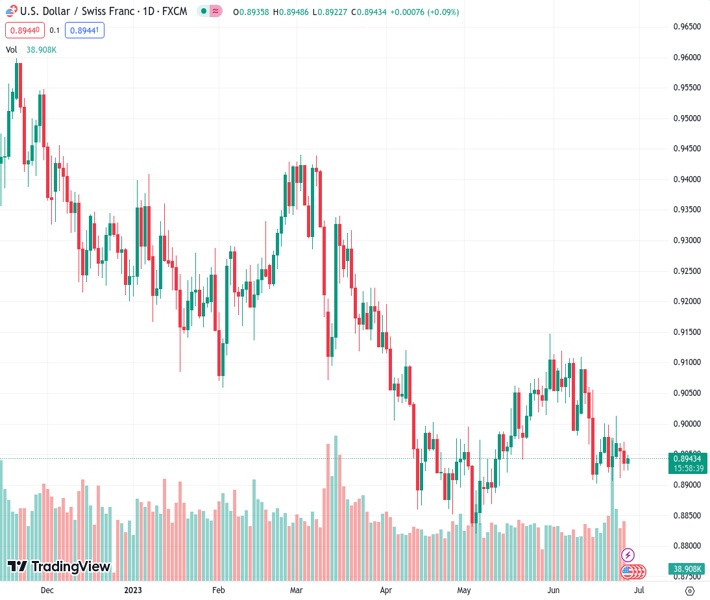
The USDCHF pair, currently at 0.89425, is experiencing its first increase in value over the course of three days. It is currently holding onto slight gains.
…
This is a premium post.
[s2If !current_user_can(access_s2member_level4)]Please register for FREE REGISTER to read full post below containing analysis. In case of any error or you think you are not able to read the full post below, please email us at support#nehcap.com [lwa][/s2If] [s2If current_user_can(access_s2member_level1)]
- USD/CHF prints the first daily gains in three, clings to mild gains of late.
The pair currently trades last at 0.89425.
The previous day high was 0.897 while the previous day low was 0.8924. The daily 38.2% Fib levels comes at 0.8942, expected to provide support. Similarly, the daily 61.8% fib level is at 0.8953, expected to provide resistance.
USD/CHF consolidates weekly losses ahead of the top-tier data/events as its prints mild gains around 0.8945, snapping a two-day losing streak, heading into Wednesday’s European session. In doing so, the Swiss Franc (CHF) pair also justifies the trader’s preference for the US Dollar amid cautious mood and hawkish Federal Reserve (Fed) bets.
That said, S&P500 Futures pare the biggest daily jump in a fortnight with mild losses whereas the US Treasury bond yields remain depressed after rising in the last two consecutive days to portray the market’s dicey momentum.
It should be noted that the contrasting headlines surrounding China and the upbeat US data also allow the USD/CHF to grind higher.
Talking about the China news, US President Joe Biden said late Tuesday that China has enormous problems. His comments were joined by the Wall Street Journal (WSJ) news saying, “The Biden administration is considering new restrictions on exports of artificial intelligence chips to China, as concerns rise over the power of the technology in the hands of US rivals, according to people familiar with the situation.”
Previously, headlines suggesting Asian lobbyists are advocating for easier rules for Chinese equities’ overseas listing and comments from Premier Li Qiang joined the People’s Bank of China’s (PBoC) lower-than-expected fixing of the USD/CNY price to tease the Oil. Further, the US Dollar selling by major Chinese state banks, per Reuters, also weighed on the USD before the upbeat data prod the greenback bears.
On Tuesday, US Durable Goods Orders marked a surprise growth of 1.7% for May versus -1.0% market forecasts and 1.2% prior (revised). Further, the US Conference Board’s (CB) Consumer Confidence Index rose to 109.7 for June from 102.5 in May (revised from 102.3). On the same line, US Housing Price Index rose to 0.7% in April from 0.5% in previous readings (revised), versus the 0.3% expected. Meanwhile, the S&P/Case-Shiller Home Price Index came in as -1.7% YoY for April, down from -1.1% prior but better than -2.6% market forecasts. Additionally, New Home Sales rose 12.2% MoM in May from 3.5% prior and 0.5% anticipated whereas the Richmond Fed Manufacturing Index improved to -7.0 in June compared to -15.0 prior and -10.0 expected.
Moving on, the Swiss ZEW Survey for June will precede the Swiss National Bank’s (SNB) Quarterly Bulletin to direct immediate USD/CHF moves ahead of Fed Chairman Jerome Powell’s speech Fed Chairman Jerome Powell
The steady RSI (14) line joins the receding bearish bias of the MACD to suggest a gradual recovery in the USD/CHF price between the 50-DMA and ascending support line from early May, respectively near 0.8980 and 0.8920.
Technical Levels: Supports and Resistances
USDCHF currently trading at 0.8942 at the time of writing. Pair opened at 0.8936 and is trading with a change of 0.07 % .
| Overview | Overview.1 | |
|---|---|---|
| 0 | Today last price | 0.8942 |
| 1 | Today Daily Change | 0.0006 |
| 2 | Today Daily Change % | 0.0700 |
| 3 | Today daily open | 0.8936 |
The pair remains strongly bearish on the daily time frame. It trades below the 20 SMA @ 0.9011, 50 SMA 0.8979, 100 SMA @ 0.9092 and 200 SMA @ 0.9316.
| Trends | Trends.1 | |
|---|---|---|
| 0 | Daily SMA20 | 0.9011 |
| 1 | Daily SMA50 | 0.8979 |
| 2 | Daily SMA100 | 0.9092 |
| 3 | Daily SMA200 | 0.9316 |
The previous day high was 0.897 while the previous day low was 0.8924. The daily 38.2% Fib levels comes at 0.8942, expected to provide support. Similarly, the daily 61.8% fib level is at 0.8953, expected to provide resistance.
Note the levels of interest below:
- Pivot support is noted at 0.8917, 0.8897, 0.887
- Pivot resistance is noted at 0.8963, 0.899, 0.901
| Levels | Levels.1 |
|---|---|
| Previous Daily High | 0.8970 |
| Previous Daily Low | 0.8924 |
| Previous Weekly High | 0.9013 |
| Previous Weekly Low | 0.8907 |
| Previous Monthly High | 0.9148 |
| Previous Monthly Low | 0.8820 |
| Daily Fibonacci 38.2% | 0.8942 |
| Daily Fibonacci 61.8% | 0.8953 |
| Daily Pivot Point S1 | 0.8917 |
| Daily Pivot Point S2 | 0.8897 |
| Daily Pivot Point S3 | 0.8870 |
| Daily Pivot Point R1 | 0.8963 |
| Daily Pivot Point R2 | 0.8990 |
| Daily Pivot Point R3 | 0.9010 |
[/s2If]
Nehcap Expert Advisor
The NEHCAP MT4 EA is high quality professional trading system geared to generate returns without using GRID or martingales. Each trade has strict risk per trade parameter. The pairs under management include EURUSD, GBPUSD, AUDCAD, AUDNZD,GBPAUD, EURAUD, EURCAD, CHFJPY and many more.
The system is trading live: LIVE ACCOUNT TRACKING
You can run it free. Apply for a free trial and track our account. Buy the system or use profit share mechanism to generate returns on your MT4.
Join Our Telegram Group
")


