The price of silver, represented by #XAGUSD, is finding it difficult to maintain its upward trend that has lasted for four days. As a result, it is moving away from its highest levels reached in the past week. The perspective from @nehcap is that a pullback is anticipated.
…
This is a premium post.
[s2If !current_user_can(access_s2member_level4)]Please register for FREE REGISTER to read full post below containing analysis. In case of any error or you think you are not able to read the full post below, please email us at support#nehcap.com [lwa][/s2If] [s2If current_user_can(access_s2member_level1)]
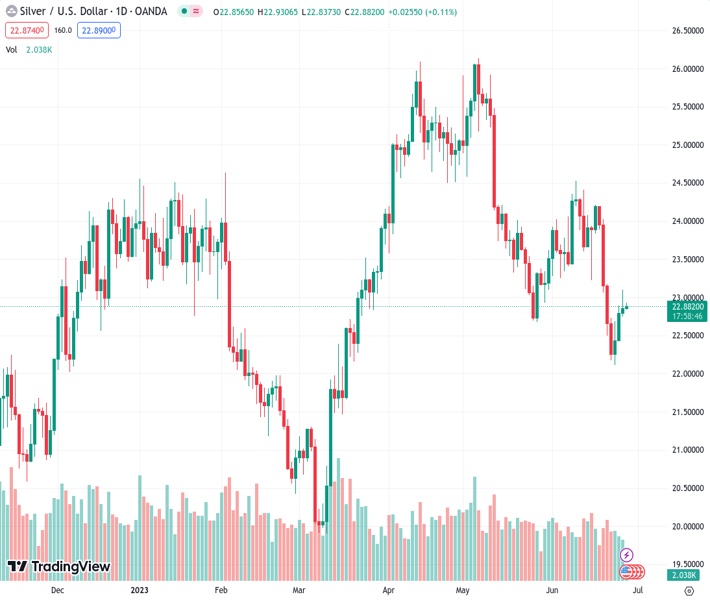
- Silver Price struggles to defend four-day uptrend, retreats from the highest levels in a week of late.
The pair currently trades last at 22.881.
The previous day high was 23.1 while the previous day low was 22.75. The daily 38.2% Fib levels comes at 22.97, expected to provide resistance. Similarly, the daily 61.8% fib level is at 22.88, expected to provide support.
Silver Price (XAG/USD) struggles to defend the four-day-old winning streak as it retreats from the weekly top surrounding $23.10 to $22.90 during early Wednesday. In doing so, the bright metal portrays the failure to cross the $23.00 key upside hurdle amid bearish MACD signals.
However, the RSI (14) condition, which is below the 50.0 level, can trigger the Silver Price rebound from the 61.8% Fibonacci retracement, also known as the golden Fibonacci ratio, of the quote’s March-May upside, close to $22.25.
Following that, the $22.00 round figure and the early March swing high of $21.30 may prod the Silver sellers before directing them to the yearly low marked in March around $19.90. It’s worth noting that the $21.00 and the $20.00 round figures may act as intermediate halts during the anticipated fall in the XAG/USD price.
Alternatively, a daily closing beyond the $23.00 resistance confluence comprising the 200-Exponential Moving Average (EMA) and 50% Fibonacci retracement, needs validation from the latest peak of $23.10 to convince the Silver buyers.
Even so, a two-week-old descending resistance line and the previous support line from March, respectively near $23.80 and $23.90, quickly followed by the $24.00 threshold, can prod the XAG/USD upside.
Above all, the Silver buyers should remain cautious unless witnessing a daily closing beyond the horizontal area comprising multiple levels marked since early January 2022, near $24.50-60.
Trend: Pullback expected
Technical Levels: Supports and Resistances
XAGUSD currently trading at 22.89 at the time of writing. Pair opened at 22.86 and is trading with a change of 0.13% % .
| Overview | Overview.1 | |
|---|---|---|
| 0 | Today last price | 22.89 |
| 1 | Today Daily Change | 0.03 |
| 2 | Today Daily Change % | 0.13% |
| 3 | Today daily open | 22.86 |
The pair is trading below its 20 Daily moving average @ 23.5, below its 50 Daily moving average @ 24.1 , below its 100 Daily moving average @ 23.33 and above its 200 Daily moving average @ 22.52
| Trends | Trends.1 | |
|---|---|---|
| 0 | Daily SMA20 | 23.50 |
| 1 | Daily SMA50 | 24.10 |
| 2 | Daily SMA100 | 23.33 |
| 3 | Daily SMA200 | 22.52 |
The previous day high was 23.1 while the previous day low was 22.75. The daily 38.2% Fib levels comes at 22.97, expected to provide resistance. Similarly, the daily 61.8% fib level is at 22.88, expected to provide support.
Note the levels of interest below:
- Pivot support is noted at 22.71, 22.56, 22.36
- Pivot resistance is noted at 23.05, 23.25, 23.4
| Levels | Levels.1 |
|---|---|
| Previous Daily High | 23.10 |
| Previous Daily Low | 22.75 |
| Previous Weekly High | 24.20 |
| Previous Weekly Low | 22.11 |
| Previous Monthly High | 26.14 |
| Previous Monthly Low | 22.68 |
| Daily Fibonacci 38.2% | 22.97 |
| Daily Fibonacci 61.8% | 22.88 |
| Daily Pivot Point S1 | 22.71 |
| Daily Pivot Point S2 | 22.56 |
| Daily Pivot Point S3 | 22.36 |
| Daily Pivot Point R1 | 23.05 |
| Daily Pivot Point R2 | 23.25 |
| Daily Pivot Point R3 | 23.40 |
[/s2If]
Nehcap Expert Advisor
The NEHCAP MT4 EA is high quality professional trading system geared to generate returns without using GRID or martingales. Each trade has strict risk per trade parameter. The pairs under management include EURUSD, GBPUSD, AUDCAD, AUDNZD,GBPAUD, EURAUD, EURCAD, CHFJPY and many more.
The system is trading live: LIVE ACCOUNT TRACKING
You can run it free. Apply for a free trial and track our account. Buy the system or use profit share mechanism to generate returns on your MT4.
Join Our Telegram Group
")


