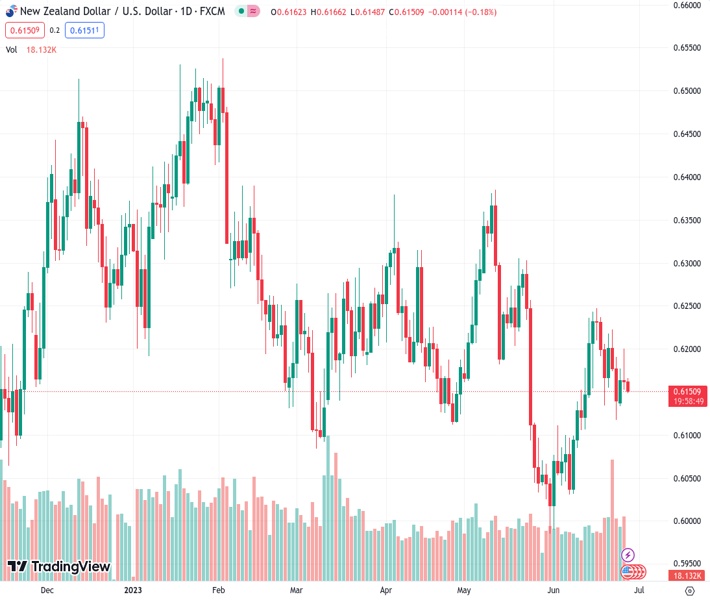
The NZDUSD currency pair is experiencing a slight decline during the Asian session, but it appears that the extent of the decrease is not significant.
…
This is a premium post.
[s2If !current_user_can(access_s2member_level4)]Please register for FREE REGISTER to read full post below containing analysis. In case of any error or you think you are not able to read the full post below, please email us at support#nehcap.com [lwa][/s2If] [s2If current_user_can(access_s2member_level1)]
- NZD/USD drifts lower during the Asian session, though the downside seems limited.
The pair currently trades last at 0.61513.
The previous day high was 0.6202 while the previous day low was 0.6143. The daily 38.2% Fib levels comes at 0.6165, expected to provide resistance. Similarly, the daily 61.8% fib level is at 0.6179, expected to provide resistance.
The NZD/USD pair extends the overnight rejection slide from the 0.6200 mark and remains under some selling pressure through the Asian session on Wednesday. Spot prices drop to a fresh daily low in the last hour and currently trade around mid-0.6100s, down 0.15% for the day.
Reports that the Biden administration is considering new restrictions on exports of artificial intelligence chips to China fuel worries about the worsening relations between the world’s two largest economies. This, in turn, is seen as a key factor driving flows away from antipodean currencies, including the Kiwi. The US Dollar (USD), on the other hand, remains on the defensive for the third straight day and might limit the downside for the NZD/USD pair, at least for the time being.
China’s Premier Li Qiang told delegates at the World Economic Forum in Tianjin on Tuesday that economic growth in the second quarter will be higher than the first and is expected to reach the annual projected target of around 5%. Apart from this, the upbeat US macro data helps ease fears of a global economic downturn and boosts investors’ confidence. This led to the overnight positive move in the US equity markets and exerts some downward pressure on the safe-haven Greenback.
That said, the Federal Reserve’s (Fed) hawkish outlook might continue to act as a tailwind for the USD and supports prospects for a further intraday depreciating move for the NZD/USD pair. In fact, the Fed earlier this month signalled that borrowing costs may still need to rise as much as 50 bps by the end of this year. Moreover, the markets have fully priced in another 25 bps lift-off at the July FOMC meeting, which continues to lend support to the US Treasury bond yields and the USD.
Hence, the focus will remain glued to Fed Chair Jerome Powell’s comments during a panel discussion at the ECB Forum on Central Banking in Sintra on Wednesday and Thursday. Investors will look for clues about the Fed’s future rate-hike move, which, in turn, will drive the USD demand and provide some meaningful impetus to the NZD/USD pair. The market attention will then shift to the release of the Fed’s preferred inflation gauge – the US Core PCE Price Index on Friday.
Technical Levels: Supports and Resistances
NZDUSD currently trading at 0.6155 at the time of writing. Pair opened at 0.6163 and is trading with a change of -0.13 % .
| Overview | Overview.1 | |
|---|---|---|
| 0 | Today last price | 0.6155 |
| 1 | Today Daily Change | -0.0008 |
| 2 | Today Daily Change % | -0.1300 |
| 3 | Today daily open | 0.6163 |
The pair is trading above its 20 Daily moving average @ 0.6135, below its 50 Daily moving average @ 0.6172 , below its 100 Daily moving average @ 0.6202 and below its 200 Daily moving average @ 0.6158
| Trends | Trends.1 | |
|---|---|---|
| 0 | Daily SMA20 | 0.6135 |
| 1 | Daily SMA50 | 0.6172 |
| 2 | Daily SMA100 | 0.6202 |
| 3 | Daily SMA200 | 0.6158 |
The previous day high was 0.6202 while the previous day low was 0.6143. The daily 38.2% Fib levels comes at 0.6165, expected to provide resistance. Similarly, the daily 61.8% fib level is at 0.6179, expected to provide resistance.
Note the levels of interest below:
- Pivot support is noted at 0.6137, 0.6111, 0.6078
- Pivot resistance is noted at 0.6195, 0.6228, 0.6254
| Levels | Levels.1 |
|---|---|
| Previous Daily High | 0.6202 |
| Previous Daily Low | 0.6143 |
| Previous Weekly High | 0.6237 |
| Previous Weekly Low | 0.6116 |
| Previous Monthly High | 0.6385 |
| Previous Monthly Low | 0.5985 |
| Daily Fibonacci 38.2% | 0.6165 |
| Daily Fibonacci 61.8% | 0.6179 |
| Daily Pivot Point S1 | 0.6137 |
| Daily Pivot Point S2 | 0.6111 |
| Daily Pivot Point S3 | 0.6078 |
| Daily Pivot Point R1 | 0.6195 |
| Daily Pivot Point R2 | 0.6228 |
| Daily Pivot Point R3 | 0.6254 |
[/s2If]
Nehcap Expert Advisor
The NEHCAP MT4 EA is high quality professional trading system geared to generate returns without using GRID or martingales. Each trade has strict risk per trade parameter. The pairs under management include EURUSD, GBPUSD, AUDCAD, AUDNZD,GBPAUD, EURAUD, EURCAD, CHFJPY and many more.
The system is trading live: LIVE ACCOUNT TRACKING
You can run it free. Apply for a free trial and track our account. Buy the system or use profit share mechanism to generate returns on your MT4.
Join Our Telegram Group
")


