The GBP/USD currency pair decreases slightly to 1.27423 during Wednesday’s Asian session, but there is limited continuation of this downward movement.
…
This is a premium post.
[s2If !current_user_can(access_s2member_level4)]Please register for FREE REGISTER to read full post below containing analysis. In case of any error or you think you are not able to read the full post below, please email us at support#nehcap.com [lwa][/s2If] [s2If current_user_can(access_s2member_level1)]
- GBP/USD ticks lower during the Asian session on Wednesday, albeit lacks follow-through.
The pair currently trades last at 1.27423.
The previous day high was 1.276 while the previous day low was 1.2704. The daily 38.2% Fib levels comes at 1.2738, expected to provide support. Similarly, the daily 61.8% fib level is at 1.2725, expected to provide support.
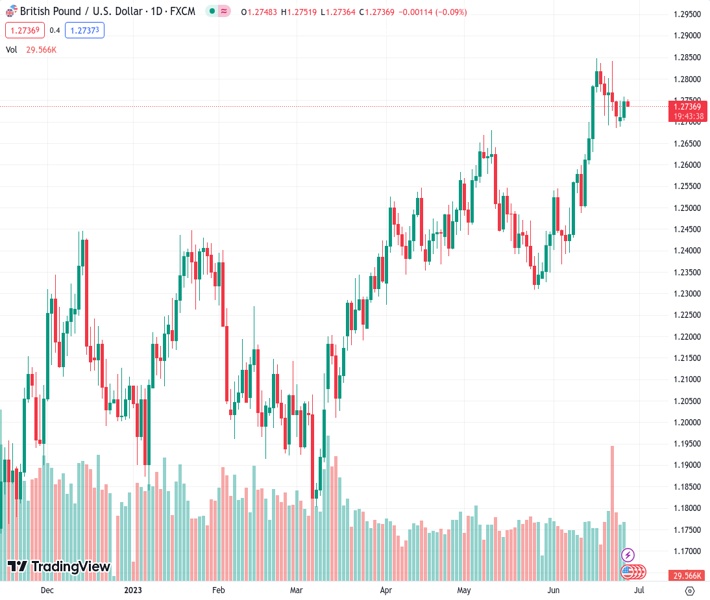
The GBP/USD pair struggles to make it through the 200-hour Simple Moving Average (SMA) and edges lower during the Asian session on Wednesday. Spot prices erode a part of the previous day’s strong gains to a fresh weekly high and currently trade just below mid-1.2700s, down less than 0.10% for the day.
Fears that the British economy is heading for recession, especially after a surprise 50 bps rate hike by the Bank of England (BoE), hold back traders from placing aggressive bullish bets around the Sterling Pound. This, in turn, is acting as a headwind for the GBP/USD pair, though a modest US Dollar (USD) weakness should help limit the downside, at least for the time being. Traders might also prefer to wait on the sidelines ahead of BoE Governor Andrew Bailey and Fed Chair Jerome Powell’s appearance in a panel discussion at the ECB Forum on Central Banking in Sintra later this Wednesday.
From a technical perspective, the recent repeated failures to find bearish acceptance below the 1.2700 mark and the subsequent move up suggests that the corrective pullback from a 14-month low might have run its course. That said, bulls might still need to wait for a sustained strength beyond 200-hour SMA hurdle, currently pegged around the 1.2755-1.2760 region, before placing fresh bets. With oscillators on hourly/daily charts holding in the positive territory, the GBP/USD pair might then reclaim the 1.2800 mark and aim to challenge the YTD peak, around mid-1.2800s touched on June 16.
On the flip side, a convincing break and acceptance below the 1.2700 round figure will be seen as a fresh trigger for bearish traders. The GBP/USD pair might then accelerate the fall towards the next relevant support near the 1.2635 horizontal zone en route to the 1.2600 mark. Some follow-through selling will make spot prices vulnerable to accelerate the downfall further towards the 1.2500 psychological mark, with some intermediate support near the 1.2530-1.2525 region.
Technical Levels: Supports and Resistances
GBPUSD currently trading at 1.2744 at the time of writing. Pair opened at 1.2748 and is trading with a change of -0.03 % .
| Overview | Overview.1 | |
|---|---|---|
| 0 | Today last price | 1.2744 |
| 1 | Today Daily Change | -0.0004 |
| 2 | Today Daily Change % | -0.0300 |
| 3 | Today daily open | 1.2748 |
The pair remains strongly bullish on the daily timeframe. It trades above its 20 SMA @ 1.2625, 50 SMA 1.2536, 100 SMA @ 1.2362 and 200 SMA @ 1.2089.
| Trends | Trends.1 | |
|---|---|---|
| 0 | Daily SMA20 | 1.2625 |
| 1 | Daily SMA50 | 1.2536 |
| 2 | Daily SMA100 | 1.2362 |
| 3 | Daily SMA200 | 1.2089 |
The previous day high was 1.276 while the previous day low was 1.2704. The daily 38.2% Fib levels comes at 1.2738, expected to provide support. Similarly, the daily 61.8% fib level is at 1.2725, expected to provide support.
Note the levels of interest below:
- Pivot support is noted at 1.2715, 1.2681, 1.2659
- Pivot resistance is noted at 1.2771, 1.2793, 1.2827
| Levels | Levels.1 |
|---|---|
| Previous Daily High | 1.2760 |
| Previous Daily Low | 1.2704 |
| Previous Weekly High | 1.2845 |
| Previous Weekly Low | 1.2685 |
| Previous Monthly High | 1.2680 |
| Previous Monthly Low | 1.2308 |
| Daily Fibonacci 38.2% | 1.2738 |
| Daily Fibonacci 61.8% | 1.2725 |
| Daily Pivot Point S1 | 1.2715 |
| Daily Pivot Point S2 | 1.2681 |
| Daily Pivot Point S3 | 1.2659 |
| Daily Pivot Point R1 | 1.2771 |
| Daily Pivot Point R2 | 1.2793 |
| Daily Pivot Point R3 | 1.2827 |
[/s2If]
Nehcap Expert Advisor
The NEHCAP MT4 EA is high quality professional trading system geared to generate returns without using GRID or martingales. Each trade has strict risk per trade parameter. The pairs under management include EURUSD, GBPUSD, AUDCAD, AUDNZD,GBPAUD, EURAUD, EURCAD, CHFJPY and many more.
The system is trading live: LIVE ACCOUNT TRACKING
You can run it free. Apply for a free trial and track our account. Buy the system or use profit share mechanism to generate returns on your MT4.
Join Our Telegram Group
")


