The EURUSD currency pair, trading at a rate of 1.09493, encountered selling pressure on Wednesday due to increased supply and moderate growth in the US dollar, leading to a decrease in its value.
…
This is a premium post.
[s2If !current_user_can(access_s2member_level4)]Please register for FREE REGISTER to read full post below containing analysis. In case of any error or you think you are not able to read the full post below, please email us at support#nehcap.com [lwa][/s2If] [s2If current_user_can(access_s2member_level1)]
- EUR/USD meets with some supply on Wednesday and is pressured by a modest USD strength.
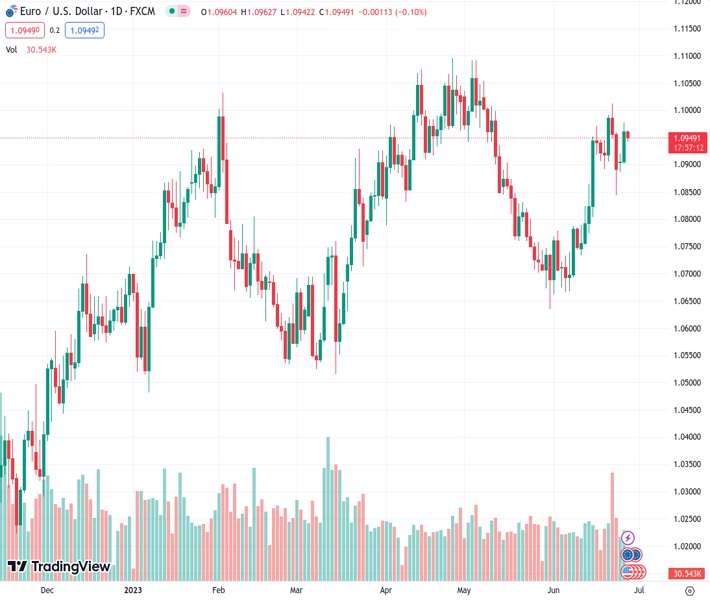
The pair currently trades last at 1.09493.
The previous day high was 1.0977 while the previous day low was 1.0902. The daily 38.2% Fib levels comes at 1.0948, expected to provide support. Similarly, the daily 61.8% fib level is at 1.093, expected to provide support.
The EUR/USD pair comes under some selling pressure during the Asian session on Wednesday and moves away from a fresh weekly high, around the 1.0975 region touched the previous day. Spot prices currently trade just below mid-1.0900s, down around 0.15% for the day, and for now, seem to have snapped a two-day winning streak.
The Federal Reserve’s (Fed) hawkish outlook, along with the upbeat US macro data released on Tuesday, assist the US Dollar (USD) to regain positive traction, which, in turn, is seen dragging the EUR/USD pair lower. Apart from this, worries about economic headwinds stemming from rising borrowing costs overshadow the prospects for additional rate hikes by the European Central Bank (ECB) and undermine the shared currency. Traders, however, might refrain from placing aggressive directional bets ahead of Fed Chair Jerome Powell’s appearance at the ECB Forum on Central Banking in Sintra later today.
From a technical perspective, any subsequent decline is more likely to find decent support near the 1.0935-1.0930 confluence – comprising the 100-hour and the 200-hour Simple Moving Averages (SMAs). The said area should act as a pivotal point, which if broken decisively might prompt some technical selling. The EUR/USD pair might then turn vulnerable to weaken further below the 1.0900 round-figure mark and accelerate the fall towards testing last week’s swing low, around the 1.0845 zone. Some follow-through selling will be seen as a fresh trigger for bearish traders and pave the way for additional near-term losses.
On the flip side, the 1.0975 region, or the weekly top, now seems to act as an immediate hurdle ahead of the 1.1000 psychological mark. Any subsequent move-up is likely to attract some sellers around the 1.1055-1.1060 resistance and remain capped near the 1.1090-1.1100 heavy supply zone, or the YTD peak touched in April/May. A sustained strength beyond the latter will confirm a fresh bullish breakout and allow the EUR/USD pair to build on its recent rise witnessed over the past month or so.
Technical Levels: Supports and Resistances
EURUSD currently trading at 1.0944 at the time of writing. Pair opened at 1.0961 and is trading with a change of -0.16 % .
| Overview | Overview.1 | |
|---|---|---|
| 0 | Today last price | 1.0944 |
| 1 | Today Daily Change | -0.0017 |
| 2 | Today Daily Change % | -0.1600 |
| 3 | Today daily open | 1.0961 |
The pair remains strongly bullish on the daily timeframe. It trades above its 20 SMA @ 1.083, 50 SMA 1.0876, 100 SMA @ 1.0814 and 200 SMA @ 1.0574.
| Trends | Trends.1 | |
|---|---|---|
| 0 | Daily SMA20 | 1.0830 |
| 1 | Daily SMA50 | 1.0876 |
| 2 | Daily SMA100 | 1.0814 |
| 3 | Daily SMA200 | 1.0574 |
The previous day high was 1.0977 while the previous day low was 1.0902. The daily 38.2% Fib levels comes at 1.0948, expected to provide support. Similarly, the daily 61.8% fib level is at 1.093, expected to provide support.
Note the levels of interest below:
- Pivot support is noted at 1.0916, 1.0872, 1.0842
- Pivot resistance is noted at 1.0991, 1.1021, 1.1066
| Levels | Levels.1 |
|---|---|
| Previous Daily High | 1.0977 |
| Previous Daily Low | 1.0902 |
| Previous Weekly High | 1.1012 |
| Previous Weekly Low | 1.0844 |
| Previous Monthly High | 1.1092 |
| Previous Monthly Low | 1.0635 |
| Daily Fibonacci 38.2% | 1.0948 |
| Daily Fibonacci 61.8% | 1.0930 |
| Daily Pivot Point S1 | 1.0916 |
| Daily Pivot Point S2 | 1.0872 |
| Daily Pivot Point S3 | 1.0842 |
| Daily Pivot Point R1 | 1.0991 |
| Daily Pivot Point R2 | 1.1021 |
| Daily Pivot Point R3 | 1.1066 |
[/s2If]
Nehcap Expert Advisor
The NEHCAP MT4 EA is high quality professional trading system geared to generate returns without using GRID or martingales. Each trade has strict risk per trade parameter. The pairs under management include EURUSD, GBPUSD, AUDCAD, AUDNZD,GBPAUD, EURAUD, EURCAD, CHFJPY and many more.
The system is trading live: LIVE ACCOUNT TRACKING
You can run it free. Apply for a free trial and track our account. Buy the system or use profit share mechanism to generate returns on your MT4.
Join Our Telegram Group
")


