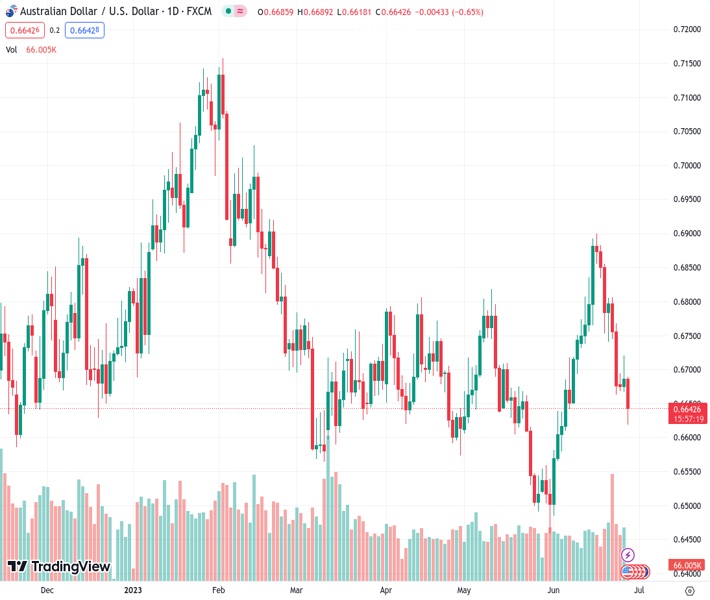
The AUDUSD pair, currently at 0.66438, has declined to a new low over several weeks in response to the weaker Australian CPI data.
…
This is a premium post.
[s2If !current_user_can(access_s2member_level4)]Please register for FREE REGISTER to read full post below containing analysis. In case of any error or you think you are not able to read the full post below, please email us at support#nehcap.com [lwa][/s2If] [s2If current_user_can(access_s2member_level1)]
- AUD/USD drops to a fresh multi-week low in reaction to the softer Australian CPI print.
The pair currently trades last at 0.66438.
The previous day high was 0.6721 while the previous day low was 0.667. The daily 38.2% Fib levels comes at 0.6701, expected to provide resistance. Similarly, the daily 61.8% fib level is at 0.669, expected to provide resistance.
The AUD/USD pair comes under intense selling pressure during the Asian session on Tuesday and dives to over a three-week low, around the 0.6620-0.6615 region. Spot prices, however, manage to trim a part of heavy intraday losses and currently trade just below mid-0.6600s, still down 0.65% for the day.
The Australian Dollar (AUD) weakens across the board in reaction to the softer domestic data, which showed that the headline CPI decelerated sharply to the 5.6% YoY rate in May from the 6.8% seen in the previous month. This, in turn, lifts the possibility that the Reserve Bank of Australia (RBA) may soon cease its rate hike cycle. Apart from this, the emergence of some US Dollar (USD) buying exerts additional downward pressure on the AUD/USD pair and contributes to the downfall.
Spot prices, however, show some resilience below the 61.8% Fibonacci retracement level of the May-June rally as traders now move to the sidelines ahead of Federal Reserve (Fed) Chair Jerome Powell’s appearance. Meanwhile, technical indicators on the daily chart have just started drifting into the negative territory and support prospects for further losses. Moreover, a sustained break and acceptance below the 0.6675 region, representing 50% Fibo. level, favours bearish traders.
The aforementioned support breakpoint should now act as an immediate hurdle for the AUD/USD pair ahead of the 0.6700 round figure, which coincides with the 100-day Simple Moving Average (SMA). Any subsequent move up is more likely to attract fresh sellers and remain capped near the 38.2% Fibo. level, around the 0.6730 region. The latter should act as a pivotal point, which if cleared will suggest that the recent sharp rejection slide from the 0.6900 mark has run its course.
On the flip side, bearish traders might now wait for some follow-through selling below the 0.6620-0.6615 area, or the daily swing low, before placing fresh bets. The AUD/USD pair might then accelerate the fall towards testing the next relevant support near the 0.6545 region. The downward trajectory could further get extended towards the 0.6500 psychological mark en route to the YTD low, around the 0.6460-0.6455 region touched in May.
Technical Levels: Supports and Resistances
AUDUSD currently trading at 0.6643 at the time of writing. Pair opened at 0.6686 and is trading with a change of -0.64 % .
| Overview | Overview.1 | |
|---|---|---|
| 0 | Today last price | 0.6643 |
| 1 | Today Daily Change | -0.0043 |
| 2 | Today Daily Change % | -0.6400 |
| 3 | Today daily open | 0.6686 |
The pair remains strongly bearish on the daily time frame. It trades below the 20 SMA @ 0.6719, 50 SMA 0.6679, 100 SMA @ 0.6709 and 200 SMA @ 0.6692.
| Trends | Trends.1 | |
|---|---|---|
| 0 | Daily SMA20 | 0.6719 |
| 1 | Daily SMA50 | 0.6679 |
| 2 | Daily SMA100 | 0.6709 |
| 3 | Daily SMA200 | 0.6692 |
The previous day high was 0.6721 while the previous day low was 0.667. The daily 38.2% Fib levels comes at 0.6701, expected to provide resistance. Similarly, the daily 61.8% fib level is at 0.669, expected to provide resistance.
Note the levels of interest below:
- Pivot support is noted at 0.6664, 0.6642, 0.6613
- Pivot resistance is noted at 0.6715, 0.6743, 0.6766
| Levels | Levels.1 |
|---|---|
| Previous Daily High | 0.6721 |
| Previous Daily Low | 0.6670 |
| Previous Weekly High | 0.6886 |
| Previous Weekly Low | 0.6663 |
| Previous Monthly High | 0.6818 |
| Previous Monthly Low | 0.6458 |
| Daily Fibonacci 38.2% | 0.6701 |
| Daily Fibonacci 61.8% | 0.6690 |
| Daily Pivot Point S1 | 0.6664 |
| Daily Pivot Point S2 | 0.6642 |
| Daily Pivot Point S3 | 0.6613 |
| Daily Pivot Point R1 | 0.6715 |
| Daily Pivot Point R2 | 0.6743 |
| Daily Pivot Point R3 | 0.6766 |
[/s2If]
Nehcap Expert Advisor
The NEHCAP MT4 EA is high quality professional trading system geared to generate returns without using GRID or martingales. Each trade has strict risk per trade parameter. The pairs under management include EURUSD, GBPUSD, AUDCAD, AUDNZD,GBPAUD, EURAUD, EURCAD, CHFJPY and many more.
The system is trading live: LIVE ACCOUNT TRACKING
You can run it free. Apply for a free trial and track our account. Buy the system or use profit share mechanism to generate returns on your MT4.
Join Our Telegram Group
")


